I’d choose the simplest recommendation system that pays back within your target period - not the one that gets the most clicks. Compare rule-based, collaborative filtering, content-based, and hybrid systems on total cost, incremental gross profit, and payback.
The difference matters: in this article’s hypothetical example, $60,000 upfront plus $3,000 per month yields 25% ROI over 12 operating months when monthly incremental gross profit reaches $10,000. That assumes full results at launch; delays and ramp-up change the return.
Quick Comparison
| Approach | Best starting point | Main cost drivers | What must justify the cost |
|---|---|---|---|
| Rule-based | Clear segments and stable rules | Setup and manual updates | Lift over no recommendations |
| Collaborative filtering | Reliable repeat interactions | Data pipelines, identity matching, and retraining | Added profit over rules |
| Content-based | Accurate product or content attributes | Metadata cleanup, tagging, and delivery | Profit from better matching |
| Hybrid | Connected account, content, and behavior data | Combined pipelines, scoring, and monitoring | Added profit over the best simpler option |
I’d test at the account level where possible, include implementation and recurring costs, and count each purchase once. Across media, SaaS, commerce, and sales, <u>clicks and pipeline movement are diagnostics - not proof of payback</u>.
1. Rule-Based Recommendations
Rule-based recommendations are the lowest-cost baseline. Their ROI depends on clean data and a small set of straightforward segments.
Data and Integration Requirements
Start with clean CRM fields: industry, company size, role, stage, and behavior signals such as downloads and pricing-page visits. Before launch, map these fields across your CRM, marketing automation platform, and CMS. Use existing systems to send account and behavior data to the rules engine. Check field accuracy and tag content by buying stage. [5][6]
Total Cost of Ownership
Rules keep starting costs low when existing tools can handle targeting. But software is only part of the cost. Budget for data cleanup, field mapping, workflow setup, and manual rule updates. That cost advantage shrinks as rules multiply and buyer behavior changes. Rules cannot find new patterns on their own. [5]
Incremental Gross-Profit Impact
Compare closed-won lift and deal value with a holdout group to calculate incremental gross profit. Count labor savings only when they cut paid labor or outsourced costs. [5][6]
Time to Payback
Match the evaluation window to the sales cycle. Faster stage progression and shorter close times are leading indicators, not proof of payback. Use rules when a few stable segments produce lift. Move on when manual upkeep grows or buyer behavior changes faster than the rules can track. [5]
When more segments or changing behavior make rules harder to maintain, compare them with collaborative filtering next.
sbb-itb-01010c0
2. Collaborative Filtering
Collaborative filtering uses account-level activity to find higher-value patterns when rules no longer reflect repeat behavior. Use it only when repeat activity can generate enough incremental gross profit to cover the added data and monitoring costs. It works best for repeat purchases or engagement, not one-time, highly customized deals.
Data and Integration Requirements
Build an interaction model with separate account, user, and role IDs. Link those IDs to timestamped purchases, repeat orders, quote requests, and engagement events. Prioritize high-signal interactions and give browsing events appropriate weight.
Use popular items for new accounts, content-based matching for new users, and product metadata for new items. Accounts with sparse activity still need fallbacks. Before launch, track coverage, repeat-interaction rate, catalog coverage, and precision. [7][8][9]
Total Cost of Ownership
Budget for identity resolution, event pipelines, retraining, monitoring, and fallback maintenance. Managed services such as Amazon Personalize reduce infrastructure work and usually avoid minimum fees or upfront commitments. But integration and internal ownership still carry costs. Compare custom and managed options over a 3-year horizon. [10]
Incremental Gross-Profit Impact
Randomize by account to keep members of the same buying group in one test group. Test whether discovery generates incremental purchases, qualified inquiries, or repeat engagement that converts to gross profit.
Report incremental gross profit separately for new and returning accounts and by product category. More clicks or larger baskets can still hide low-margin recommendations.
Time to Payback
Calculate payback as implementation cost ÷ (monthly incremental gross profit − monthly operating cost). If the denominator is zero or negative, the system never pays back its cost. Use the same gross-profit assumptions as the test, then compare payback across placements before scaling.
Start with one repeat-use placement, such as an account reorder page, and run the test long enough to capture the buying cycle.
Scale only when measured profit, not attributed revenue, meets the payback target. If interaction data stays sparse, compare this model with content-based recommendations next.
3. Content-Based Recommendations
When interaction data is limited, content quality becomes the main ROI lever. Content-based systems match item metadata to visitor intent. They work best in editorial libraries, technical docs, and catalogs where topic, use case, and specs matter more than shared behavior. Unlike collaborative filtering, they can launch with little behavior data. Existing structured content cuts setup work, and new items can rank immediately when their fields are complete.[11][14]
Data and Integration Requirements
Connect the CMS, PIM, CRM, analytics stack, and delivery layer to the recommendation engine. Standardize fields for topic, industry, role, stage, category, use case, company size, format, date, and specs. Use controlled vocabularies, synonym maps, category hierarchies, and eligibility filters to block restricted, obsolete, or incompatible items.[11][12]
Total Cost of Ownership
TCO includes taxonomy design, tagging, cleanup, model or embedding infrastructure, APIs, integration, analytics, monitoring, governance, and recurring editorial maintenance. Verified attributes make recommendations easier to explain, but duplicate suppression and diversification require continued tuning.[12][13][15]
With metadata and governance costs accounted for, test whether better matching produces measurable profit.
Incremental Gross-Profit Impact
Measure incremental gross profit, not clicks. Count paid subscriptions, qualified inquiries, activation, or expansion that would not have happened without the recommendations. For media businesses, tie registrations and return visits to a defensible monetization model before assigning profit. Track diversity alongside conversion results so repetitive recommendations don't hide a shrinking range of content discovery. Treat external commerce benchmarks as directional context only.[13][15]
If testing confirms a lift, payback depends on how much tagging, cleanup, and governance the content stack needs.
Time to Payback
Include taxonomy cleanup, integration, QA, experimentation, and sales attribution in implementation costs. Add metadata maintenance to operating costs. Payback occurs when cumulative incremental gross profit covers total ownership cost. Structured content and enough traffic can shorten that path, but engagement alone doesn't establish payback without a defensible dollar value.
4. Hybrid AI Recommendations
Hybrid systems combine collaborative, content-based, session, and rule signals when single-method models plateau. Use them only when they outperform simpler alternatives after costs. Eligibility rules remain hard constraints: contracts and product compatibility override predicted interest. As account activity grows, collaborative signals can carry more weight.
Data and Integration Requirements
Join CRM, ERP, catalog, inventory, and impression data.[16] Set the fallback order to personalized results first, account- or segment-level results next, and rules for visitors with little history. Give each rule an owner and an expiration date so outdated priorities don't override the model.[7]
Total Cost of Ownership
Multiple pipelines, scoring, fallback logic, monitoring, and retraining increase the break-even threshold. Published estimates put mid-complexity hybrid systems at $30,000–$150,000 and enterprise deployments above $500,000. Annual maintenance runs 15%–25% of the initial build cost.[2]
Incremental Gross-Profit Impact
Infosys BPM reports $20 million in projected business-case benefits from a hybrid recommendation deployment in an Australian telecom account, including $17 million in cross-sell and $3 million in upsell.[4] Treat this as directional, not measured incremental profit.
Time to Payback
Compare hybrid systems with the best simpler alternative. Added incremental gross profit must cover implementation and operating costs within the target payback period, accounting for B2B sales-cycle delays. Track results by account segment, along with latency, coverage, and price mismatches.[7] Treat hybrid complexity as the upper cost bound only if simpler systems cannot meet the same payback target.
Ownership Costs and Payback
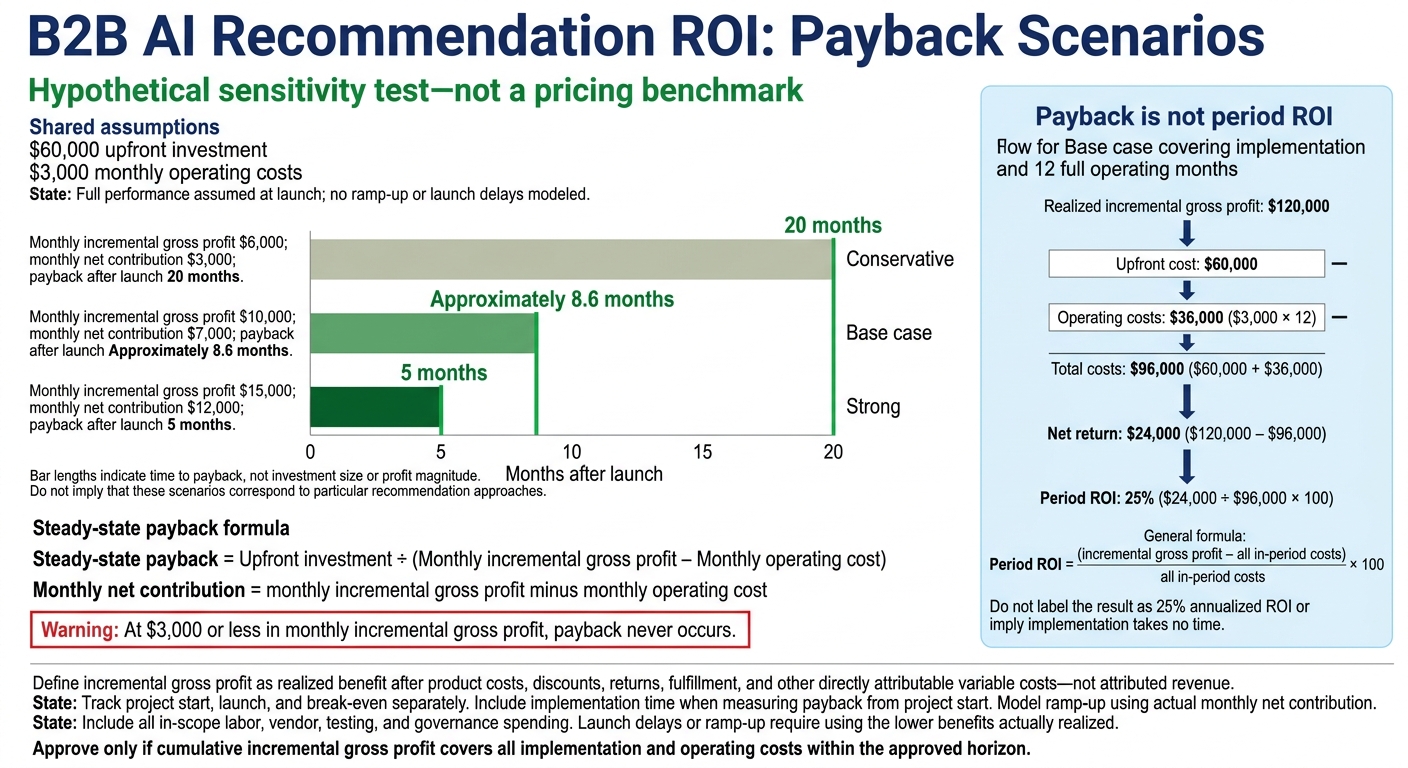
B2B AI Recommendation ROI: Payback Scenarios
Once the model mechanics are clear, ROI comes down to total ownership cost and time to break even.
Custom Builds vs. Managed Platforms
Compare the same scope over the same period. Separate one-time implementation costs from recurring spending. Include engineering, integrations, tracking, data cleansing, taxonomy, pipelines, testing, security and consent, training, and adoption support. Recurring costs include staffing, hosting, monitoring, support, governance, manual review, and integration maintenance.[18][19]
The table shows model-specific costs beyond these shared requirements.
| Approach | Custom build: one-time / recurring costs | Managed platform or API: one-time / recurring costs | Opportunity costs and exclusions |
|---|---|---|---|
| Rule-based | Rule engine, eligibility logic / Rule updates, editorial review | Rule configuration / Subscription or usage fees, internal rule maintenance | Staff time diverted to rule upkeep; exclude unused model infrastructure. |
| Collaborative filtering | Interaction histories, identity resolution, model development, cold-start handling / Retraining, interaction-data checks | Event feeds, identity mapping, data preparation / Vendor charges, feed maintenance | Engineering time diverted from other projects; vendor lock-in. Do not double-count vendor-bundled costs. |
| Content-based | Attribute extraction, taxonomy, metadata cleanup, model development / Catalog enrichment, model updates | Catalog mapping, metadata preparation / Vendor fees, catalog synchronization, relevance review | Editorial or product-team time diverted to metadata work; exclude unused interaction-history pipelines. |
| Hybrid | Combined data preparation, model orchestration, feature stores where needed / Serving, retraining, specialist labor | Combined feed configuration / Platform and usage charges, internal oversight | Specialist time diverted from other work; exclude infrastructure the delivery model does not require. |
Keep paid internal labor in the cost ledger, but report displaced work separately - do not count the same hours twice. For managed delivery, check minimum commitments, overages, data-transfer fees, premium support, and exit costs. Count harms once through observed profit. Do not add a separate irrelevance penalty if conversion or returns already reflect it.[17]
Payback Across 3 Profit Scenarios
The sensitivity test below compares payback across 3 profit scenarios using the same cost structure. Actual proposals need their own cost estimates to show which delivery model reaches break-even fastest.
This hypothetical sensitivity test is not a pricing benchmark. Each scenario assumes $60,000 upfront and $3,000 in monthly operating costs. Incremental gross profit means realized benefit after product costs, discounts, returns, fulfillment, and other directly attributable variable costs - not attributed revenue.[19]
Steady-state payback = Upfront investment ÷ (Monthly incremental gross profit − Monthly operating cost)
Scenario Monthly incremental gross profit Monthly net contribution Payback after launch Conservative $6,000 $3,000 20 months Base case $10,000 $7,000 Approximately 8.6 months Strong $15,000 $12,000 5 months At $3,000 or less in monthly gross profit, payback never occurs.
These results assume full performance at launch. Track project start, launch, and break-even separately, and model ramp-up using actual monthly net contribution. Include implementation time when measuring payback from project start. A lower implementation bill does not guarantee faster payback if recurring fees absorb the savings.
Payback is not period ROI.
Period ROI = (Realized incremental gross profit − all in-period costs) ÷ all in-period costs × 100
Under the same base-case assumptions, an evaluation covering implementation and 12 full operating months yields $120,000 in benefits − $96,000 in costs ($60,000 + $36,000) = $24,000 net return, or 25% ROI. Costs must include all in-scope labor, vendor, testing, and governance spending; launch delays or ramp-up require using the lower benefits actually realized.
B2B Industry Outcomes and ROI Evidence
Compare each model by the incremental gross profit it can generate against its payback target. The table maps each B2B use case to the outcomes that matter for ROI. Treat it as a planning framework, not proof of measured returns.
| Industry | Approach fit | Business outcome | Pre-profit signal | How it becomes profit | Typical test window |
|---|---|---|---|---|---|
| B2B media | Content-based or hybrid | Paid subscriptions; advertising yield | Session depth; return visits; content-to-MQL conversion | Additional subscription or advertising gross profit | Suggested 30–90-day engagement test |
| SaaS | Collaborative filtering or hybrid; content-based for new users | Activation; retention; expansion | Feature adoption; time to value; product-qualified leads | Realized expansion margin and retained customer margin | Suggested 6–12 months |
| Marketplaces and commerce | Collaborative filtering or hybrid; rules for eligibility | Qualified inquiries; purchases | Search-to-inquiry conversion; attach rate | Additional order or transaction margin after displacement and variable costs | Inquiry through completed purchase |
| Sales | Content-based or hybrid, constrained by account eligibility | Better opportunity quality and productivity | Pipeline velocity; win rate | Additional closed-won margin or documented cost savings | Marketing response through sales close; separate renewal tracking |
The subsections below explain what to measure in each industry.
B2B Media: Engagement and Revenue
Track session depth, return visits, subscriptions, and content-to-MQL conversion separately for article, newsletter, and directory recommendations. Count only incremental gross profit from paid subscriptions, qualified downstream sales, or advertising.
SaaS: Activation, Expansion, and Retention
Measure activation and time to value first. Then track feature adoption, PQLs, expansion, and renewals at the account level. Count realized expansion and retained customer margin, but don't count the same revenue again through improved net revenue retention.
Marketplaces and Commerce: Inquiries and Purchases
Link qualified inquiries to completed purchases. Check matching quality, order value, and attach rate along the way. Test ecommerce-derived assumptions against B2B transactions, then subtract displaced purchases and variable costs to calculate incremental transaction margin.
Sales: Opportunity Quality and Productivity
Use pipeline velocity, cycle length, win rate, MQL-to-SQL conversion, and preparation time as diagnostics, not realized profit. Track marketing response, sales close, and renewals in separate windows. Count gains only as incremental closed-won margin or documented cost savings.
Testing Incremental Profit
Report clicks, assisted conversions, and MQLs separately from realized profit. Label outside evidence as independently validated, vendor-reported B2B, or ecommerce-derived only when its source and verification history support that label. Label modeled outcomes as hypothetical.
Conclusion: Choose by Break-Even Requirements
Choose the simplest model that clears break-even based on the lift and payback evidence above. Use this matrix to match model complexity to your needs, with volume, catalog, cost, and profit assumptions drawn from your own business data.
| Decision factor | Rule-based | Content-based | Collaborative filtering | Hybrid AI |
|---|---|---|---|---|
| Data readiness | Sparse history; clear business rules | Strong product or content metadata | Dense, reliable repeat interactions | Connected behavioral, content, and account data |
| Traffic volume | Low volume favors low overhead | Works with limited interaction volume | Enough repeat activity to learn preferences | Enough traffic to test added value |
| Catalog breadth | Small catalog that's easy to maintain | Well-described items, including new ones | Broad catalog with repeat interactions | Complex catalog and multiple contexts |
| Sales-cycle length | Clear rules suit slow feedback | Attributes help when purchases are infrequent | Repeat usage can supply signals between purchases | Requires tracking through the revenue cycle |
| Incremental gross profit | Must cover a low-cost baseline | Must cover metadata preparation and delivery | Must also cover pipelines and retraining | Must exceed baseline profit after added costs |
| Integration complexity | Usually low | Metadata mapping required | Identity and interaction pipelines required | Multiple data sources and workflows |
| Compliance | Rules are easier to audit | Attributes are easier to explain | Review behavioral data use and access | Review vendor data use, access, and auditability |
| Payback horizon | Favor when fast payback is required | Favor when usable metadata speeds launch | Allow for learning and revenue delays | Approve only if it clears the payback horizon |
| Internal ML capacity | Usually unnecessary | Low to moderate | More modeling and monitoring capacity | Managed tools reduce, but don't eliminate, internal work |
The model must pay back within the approved horizon. Favor rules or content-based recommendations for a fast, explainable baseline. Use collaborative filtering only when repeat interactions are dense, and hybrid only when tests justify the added cost. Reserve custom builds for scale, differentiation, control, or long-term economics.
Count integration, data preparation, internal labor, infrastructure, maintenance, monitoring, retraining, and compliance costs, not just the platform fee. AWS also recommends budgeting for recurring personnel, infrastructure, and monitoring costs.[20]
Break-even rule: Approve only if cumulative incremental gross profit covers all implementation and operating costs within the approved horizon.
FAQs
How much data do I need for a reliable ROI test?
There’s no universal minimum sample size. The number you need depends on your hypothesis and the level of statistical confidence you want. Set a test duration that accounts for relevant variables, collect data consistently, flag anomalies, and remove bias. Use Bayesian inference or A/B/n testing to assess statistical reliability.
The B2B Ecosystem provides resources and advisory services to help improve data strategies and connect operational metrics to financial outcomes.
How can I isolate recommendation lift from other marketing efforts?
Measure recommendation lift separately from overall marketing results. Compare AI-powered recommendations with non-AI approaches to isolate the difference in performance [1].
Use multi-touch attribution to track recommendation interactions alongside other customer touchpoints [1][2]. Connect your marketing platforms to your CRM, and use server-side, consent-based tracking to assign revenue credit to AI-powered touchpoints and measure their contribution to ROI [1][2].
When should I stop a recommendation pilot?
Stop a recommendation pilot if it produces a negative return on investment (ROI). Immediately review your approach, targeting, or performance tracking [1]. End or change the pilot if it fails to meet the success metrics and statistical significance thresholds set before testing [2].
Repeated data quality problems or failure to show value despite clear goals also call for a review [1][2]. For guidance, contact DevriX or consult The B2B Ecosystem [3][2].