If I want to judge future digital growth, I look at NRR, CAC payback, and pipeline velocity first - not revenue that has already posted.
Here’s the short version: this piece says the best growth signals usually come from two places - market readiness and company-level unit economics. At the market level, cloud use, digital maturity, ecommerce alignment, SaaS spending, and AI use can show where demand is building. At the company level, NRR above 110% and CAC payback under 12 to 14 months stand out as the clearest signs of a healthy model.
If I had to boil the article down to a few points, it would be these:
- Lagging metrics like revenue and EBITDA show the past
- Leading metrics like pipeline velocity and conversion rate point to what may happen next
- SaaS firms should track NRR, CAC payback, LVR, and pipeline speed
- Marketplaces should watch liquidity, time-to-match, and win rate
- Ecommerce brands should focus on conversion rate, AOV, and repeat purchase rate
- Digital media firms should track engagement, active users, and retention
- Clean CRM, marketing, and billing data matter, or forecasts drift fast
A few figures stand out. The article notes 94% cloud adoption across B2B enterprises, 28% year-over-year growth in B2B SaaS, and 72% of businesses that assess digital maturity report faster growth. Those numbers do not pick winners by themselves. But they do help show which markets are set up for digital expansion.
So the main takeaway is simple: use market signals to find where growth can happen, then use unit economics to test whether a company can turn that demand into durable revenue.
Macro-Level Metrics That Signal Digital Expansion
Macro signals show which markets are set up for digital growth. They do not tell you which company will come out ahead.
Infrastructure and Connectivity Indicators
Infrastructure comes first. If a market has broad cloud use and a strong shift toward cloud-native development, it’s in a much better spot to scale digital services without a lot of friction.
In 2023, cloud adoption reached 94% across B2B enterprises, and 70% of new B2B applications used cloud-native architectures [4]. In that same year, 85% of B2B enterprises had started digital transformation programs, and 62% had rolled them out across operations [4].
Those numbers matter because they point to more than IT upgrades. They show a market that has already done much of the base work needed to support digital products, workflows, and customer experiences at scale.
Digital Usage, Commerce, and Innovation Indicators
Once the base is in place, usage patterns tell you something else: whether companies are turning digital adoption into business growth.
A few signals stand out here. Digital maturity is one of the strongest composite indicators. 72% of businesses that assess it report accelerated growth [3]. Ecommerce alignment also helps separate stronger operators from the rest. 54% of top-performing firms say their ecommerce goals are highly aligned with business goals [3].
Software spend adds another clue. 28% year-over-year growth in B2B SaaS points to steady demand-side investment [4]. And on the AI front, 67% of B2B AI initiatives focus on predictive analytics, which helps firms improve demand forecasting [4].
The table below pulls together the macro indicators with the clearest predictive value.
| Metric Area | Sample Measure | Predictive Signal |
|---|---|---|
| Digital Maturity | 72% actively assess maturity [3] | Indicates faster growth potential [3] |
| Ecommerce Alignment | 54% of top-performing firms report highly aligned ecommerce goals [3] | Signals stronger execution [3] |
| Software Spending | 28% year-over-year growth in B2B SaaS [4] | Signals sustained demand-side investment [4] |
| AI and Forecasting | 67% of B2B AI initiatives focus on predictive analytics [4] | Supports more accurate demand forecasting [4] |
These macro signals show where digital demand is getting deeper. The next layer is firm-level metrics, which show which companies are set up to take that demand and turn it into results.
sbb-itb-01010c0
Firm-Level Metrics With the Strongest Predictive Value
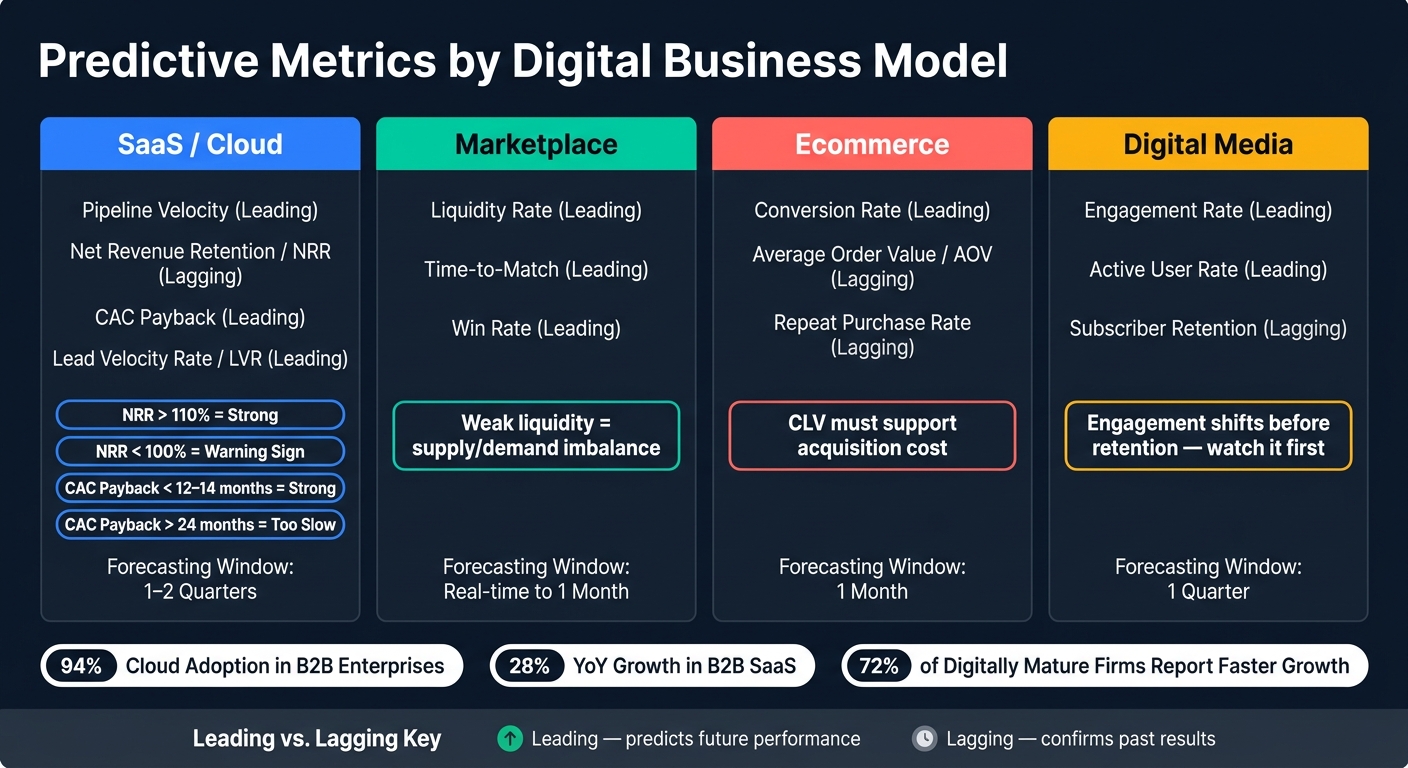
Predictive Metrics by Digital Business Model: SaaS, Marketplace, Ecommerce & Media
Firm-level metrics show which companies turn market readiness into growth. These are the numbers operators, CFOs, CROs, and investors use to judge revenue quality, capital use, and room to expand.
SaaS and Cloud Metrics
One of the best early signals in SaaS is Pipeline Velocity - the value moving through the sales pipeline each day. It brings together open opportunity volume, average deal size, win rate, and sales cycle length to help forecast cash flow and spot where growth is starting to stall [1]. If the sales cycle gets longer, that usually points to friction later in the process. If win rate drops, the problem is often weak targeting.
For revenue quality, Net Revenue Retention (NRR) is the key number to watch. NRR above 110% is a strong enterprise SaaS benchmark [1]. It shows that current customers are expanding fast enough through upsells, cross-sells, or seat growth to drive compounding revenue. When NRR drops below 100%, churn and contraction are moving faster than expansion. That's a clear warning sign around product-market fit or customer success [1].
CAC payback equals sales and marketing spend divided by net new ARR × gross margin. Under 12 to 14 months is strong. Above 24 months is usually too slow [1]. The gross margin adjustment matters because it ties payback to actual recovery speed, not just topline bookings.
Lead Velocity Rate (LVR) is another helpful early signal, especially when you pair it with website engagement and opportunity-to-win rate.
Marketplace, Ecommerce, and Digital Media Metrics
Other digital models need a different set of signals.
In marketplaces, liquidity rate, time-to-match, and win rate show whether supply and demand are clearing the way they should. Weak liquidity usually means the market is out of balance.
In ecommerce, conversion rate is the clearest leading signal. AOV and repeat purchase rate shape CLV, and CLV should support acquisition cost [2].
In digital media, subscriber retention and active user rate matter most. Engagement usually shifts before retention does, which makes it the earlier read on where things are headed.
| Digital Model | Core Predictive Metrics | Leading or Lagging | Typical Forecasting Window |
|---|---|---|---|
| SaaS / Cloud | Pipeline Velocity, NRR, CAC Payback | Velocity (Leading); NRR (Lagging) | 1 to 2 quarters |
| Marketplace | Liquidity Rate, Time-to-Match, Win Rate | Leading | Real time to 1 month |
| Ecommerce | Conversion Rate, AOV, Repeat Purchase Rate | Conversion (Leading); AOV (Lagging) | 1 month |
| Digital Media | Subscriber Retention, Active Users, Engagement | Engagement (Leading); Retention (Lagging) | 1 quarter |
There’s also a data discipline issue here. 44% of sales teams struggle to align with marketing [2], and that can make metrics like CAC payback and pipeline velocity less dependable. If one system defines company size one way and another uses a different annual revenue bracket, the reporting starts to drift. Standardizing field definitions across CRM and marketing platforms is a prerequisite for trustworthy predictive reporting [1].
The next section turns these metrics into screening rules for investors and operators.
How Investors and Operators Apply Predictive Metrics
Once the metrics are set, the next step is simple: decide who uses them and what decisions they drive. The metrics themselves don't change. The rules for using them do.
Screening Metrics for VC, Growth Equity, and PE
Venture investors tend to screen on NRR and CAC Payback. The goal is to see whether a company can reach venture-scale growth without burning too much capital [1].
Growth-stage operators usually zero in on Pipeline Velocity. That helps them spot bottlenecks in the commercial engine - where deals slow down, stall, or fall apart [1].
PE portfolio leaders look more closely at Gross Revenue Retention (GRR), CLV, and EBITDA-linked operating metrics. Those numbers help protect margin and steer capital toward channels with better returns [1].
| Metric Category | VC Priority | Growth-Stage Operator Priority | PE Priority |
|---|---|---|---|
| Growth & Scale | NRR (>110%) | Pipeline Velocity, Lead Conversion Rate | MRR Growth |
| Unit Economics | CAC Payback (<14 months) | Cost Per Opportunity, ACV | Gross Margin, CLV |
| Retention | Expansion ARR, Net Retention | Product Usage Triggers, NPS | Gross Revenue Retention (GRR) |
| Efficiency | Magic Number, Capital Efficiency | Sales Cycle Length, Win Rate | EBITDA-linked operating metrics |
Putting Metrics to Work in Portfolio and B2B Environments
Knowing which metrics matter is only half the job. The harder part is building workflows that keep those numbers accurate and useful across teams. That means tight alignment across functions - Marketing on Pipeline Sourced, Sales on Win Rate and ACV, and Success on GRR and NRR. When those teams work from the same logic, attribution leakage is less likely and forecasts hold up better [1].
These screening rules depend on clean, consistent data, which is the focus of the forecasting framework below.
Data Sources, Methods, and a U.S. Forecasting Framework
Data Sources and Modeling Approaches
Once the metrics are set, the next step is simple: get clean data from the systems that run the business. Static reports can help with a snapshot, but they’re a weak base for forecasting. For U.S. B2B teams, the most useful inputs usually come from CRM, web analytics, marketing automation, and ERP or cloud systems. Those tools supply the operating metrics used across the rest of the framework.
| Source Category | Reliable U.S. Data Sources/Platforms | Key Growth Signals Tracked |
|---|---|---|
| CRM & Data Management | Salesforce, HubSpot, Microsoft Dynamics 365 | Pipeline velocity, lead conversion, sales funnel visibility |
| Analytics & Behavior | Google Analytics 4, SEMrush, Hotjar | Website engagement, bounce rates, keyword tracking, user heatmaps |
| Automation & Reporting | Marketo, Pardot | Lead scoring, attribution modeling, automated reporting |
| Infrastructure | Enterprise ERPs, Cloud Storage (B2B) | Contract metrics, billing and compliance data |
If your CRM, marketing platform, and customer success data all live in separate silos, forecasting starts to drift fast. CLV and CAC payback get distorted. Inconsistent field values skew reporting. Put plainly, data hygiene is what makes B2B forecasting dependable.
Attribution also needs to fit how deals actually close. Long enterprise sales cycles call for multi-touch or W-shaped models, not a basic first-touch setup [1]. A simple review cadence helps keep the picture honest: weekly checks on pipeline velocity and speed-to-lead, then monthly audits of NRR and CAC payback. That’s how you see whether growth is moving in the right direction.
Conclusion: The Metrics That Matter Most
For forecasting, aim for NRR above 110% and CAC payback under 12 to 14 months. Once payback stretches past 24 months, the model stops working. Siloed data and vanity metrics don’t help - they turn forecasting into a backward-looking report.
FAQs
Why is NRR more useful than revenue for forecasting growth?
Net Revenue Retention (NRR) tells you more because it shows whether a company can keep and expand revenue from the customers it already has, not just post bigger top-line sales.
That matters because total revenue can look good even when a business is losing customers or leaning hard on new sales to fill the gap. NRR gives you a cleaner read on what’s happening inside the customer base.
It folds in the main moving parts:
- churn
- downgrades
- upsells
- cross-sells
So instead of showing only how much a company sold, NRR shows how revenue from existing customers changes over time. That makes it a better signal of product-market fit, customer loyalty, and more predictable long-term growth.
What is a good CAC payback period for a digital business?
For B2B digital businesses, a good CAC payback period usually lands between 12 and 24 months.
Some enterprise models target less than 12 to 14 months. On the other hand, anything above 24 months is usually viewed as mathematically unsustainable.
You calculate CAC payback period by dividing total sales and marketing spend by net new annual recurring revenue, then multiplying by gross margin percentage.
Which predictive metrics matter most for my business model?
The right predictive metrics depend on your goals, but recurring revenue and efficiency are the best place to start.
For subscription businesses, keep a close eye on MRR, ARR, and NRR. These numbers help you project growth and gauge long-term account value.
You should also track CAC, CAC payback period, churn, and LTV to see whether growth is holding up financially. As a rule of thumb, CAC payback should land in the 12-24 month range. If it stretches much past that, growth can start to get expensive fast.
It also helps to measure performance against the Rule of 40. That gives you a simple way to weigh growth against profit instead of chasing one at the expense of the other.