Natural Language Processing (NLP) is transforming how businesses interact with data by making Business Intelligence (BI) dashboards easier for everyone to use - no technical skills required. Instead of relying on SQL or waiting for custom reports, you can now ask questions in plain English, like "What was our revenue last quarter?" and get instant, accurate answers. This shift saves time, improves decision-making, and makes data accessible to non-technical users across departments.
Key benefits of NLP-powered BI dashboards include:
- Faster Insights: Query results are delivered in seconds, cutting analysis time by up to 68%.
- Ease of Use: Non-technical users can explore data without relying on IT or analysts.
- Automated Narratives: Complex charts are converted into simple, written summaries.
- Personalized Dashboards: Tailored insights based on roles and user behavior.
- Context-Aware Alerts: Notifications explain trends and anomalies in detail.
Real-world examples highlight its impact. For instance, Toyota North America sped up insights by 21x in 2025, while JPMorgan Chase reduced executive data analysis time by 40%. By integrating NLP with tools like Snowflake Cortex and semantic layers, companies can streamline operations, improve data accuracy, and empower teams to act faster.
Conclusion: NLP-powered dashboards are changing BI, making data analysis faster, simpler, and more accessible for everyone. If you're not using them yet, you're already behind.
Power BI Q&A Feature Explained | Create Charts Instantly with Natural Language | Power BI AI
sbb-itb-01010c0
Natural Language Querying: Ask Questions in Plain English
The way we interact with data has undergone a major transformation. Instead of clicking through endless menus or waiting for custom reports, users can now simply type or speak questions like, "What was our revenue in Q4?" and get instant answers. This conversational approach feels intuitive because it mirrors how we naturally think and ask about business challenges.
How NLP Converts Questions into Database Queries
Turning plain English into precise database queries involves several steps to ensure both accuracy and speed. First, Natural Language Understanding (NLU) identifies the intent behind the question and pulls out key terms. Then, a semantic layer connects those terms to the correct database fields. Finally, a retrieval-augmented generation process - supported by caching - translates the query into optimized SQL or Python code [1][6]. For frequently asked questions, caching ensures results are delivered in under a second, cutting costs and boosting efficiency [1].
A real-world example? In May 2025, Power Digital Marketing adopted Snowflake Cortex under John Saunders, VP of Product. This integration allowed their strategists to pull data from multiple sources using plain language. The result? A ~30x speed improvement in generating insights and over three workweeks saved on manual analysis across hundreds of queries [9].
This seamless process enables teams across the board to quickly access actionable insights.
Benefits for Non-Technical Users
Non-technical users now have the power to explore data without needing to rely on analytics teams. For example, marketing managers can dive into campaign performance, HR leaders can examine retention trends, and executives can analyze regional sales - all without waiting a week or two for custom reports [5].
The time savings are staggering. For instance, finding quarterly revenue traditionally takes 45 seconds with a dashboard but only 8 seconds with natural language querying [5]. More complex tasks, like investigating why a metric shifted, can drop from over 5 minutes of clicking through dashboards to just 30 seconds using iterative questions [5]. Companies adopting this approach report a 68% reduction in time-to-insight and a 73% increase in active data users [8].
"The real value of natural language analytics is not just convenience, it changes how teams use data. Instead of relying on analysts or waiting for dashboards, business users can explore data on their own." - Deepak Singh, SEO & Content Writer, Supaboard [7]
When done correctly, these systems deliver up to 99.8% accuracy and significantly reduce hallucinations - by over 50% [9]. The secret lies in defining business terms clearly and applying them consistently across all queries, eliminating the inconsistencies that often plague manually created reports.
Automated Narratives: Converting Data into Written Summaries
NLP doesn’t just simplify data queries - it also transforms complex visuals into easy-to-understand narratives.
While charts and graphs can tell a story, not everyone has the time or expertise to interpret them. Automated narratives step in to bridge this gap. These systems use NLP to turn raw data and visualizations into plain-language summaries, making insights more accessible. Instead of analyzing visualizations, users can read concise explanations that highlight key changes.
Here’s how it works: a data translation layer converts structured outputs - like churn rates or funnel drop-offs - into business-friendly language rather than technical jargon [6]. Advanced pattern recognition pinpoints trends, such as "steep declines" or "growth spikes", and calculates relative percentages between data points [10]. These summaries remain dynamic, updating in real time [10]. A semantic layer ensures the narratives align with your organization’s established business rules and data standards [9].
The impact is clear. Companies using these B2B SaaS AI tools report making decisions five times faster and uncovering insights 40% quicker compared to traditional methods [9]. On average, business users save 7–10 hours weekly by querying and summarizing data themselves instead of relying on analysts [9].
Executive-Friendly Reporting
Executives and stakeholders often don’t have the bandwidth to sift through detailed dashboards. Automated narratives solve this problem by delivering quick, easy-to-read summaries that focus on the most critical insights.
"Instead of forcing workers to interpret the visualization of data, all they need to do is read the written summary." - Stuart Frankel, CEO of Narrative Science [4]
These summaries reduce the risk of misinterpretation by providing clear explanations, eliminating the need to manually connect the dots between metrics and dimensions [10]. Shifting from dashboards to written insights allows leaders to focus on decision-making rather than data analysis, ensuring they can act swiftly and effectively.
Examples of Narrative Use Cases
The power of automated narratives becomes even clearer when applied to real-world scenarios.
For example, in revenue analysis, the system might highlight that Q4 revenue dropped 18% compared to Q3, driven by a 23% decline in the Northeast region during December. In customer retention, it could flag operational issues like "SLA breaches occurred exclusively in Pacific timezone accounts between 2:00 AM and 4:00 AM" or "churn spiked 31% among users who completed onboarding in under 48 hours" [11].
These narratives don’t just present numbers - they explain the reasons behind trends. For instance, a narrative might attribute a sales decline to competitor promotions or shipping delays, offering actionable insights to guide corrective measures [11]. Whether analyzing long-term patterns or sudden changes, automated narratives transform complex data into clear, actionable intelligence. By doing so, they enhance the value of BI dashboards and demonstrate how NLP can revolutionize data visualization.
Personalized Dashboards and Insights
NLP takes BI dashboards to the next level by turning them into smart, tailored interfaces that adjust to individual users' needs. By analyzing user behavior, NLP not only customizes dashboard views but also streamlines operations - making interactions with BI tools more effective.
For example, NLP can prioritize insights based on patterns it detects. If a user frequently asks for "sales last month" followed by "what about by region?", the dashboard retains the timeframe without needing the user to repeat it. Over time, these interactions fine-tune the dashboard, shifting it from being reactive to proactive. Instead of waiting for user input, NLP-powered dashboards can anticipate needs, display relevant data visualizations, and even flag anomalies automatically [12].
Role-Based Customizations
Through a semantic layer, NLP maps database fields to business concepts tailored to specific roles. This ensures users see only the data relevant to their responsibilities, all while maintaining proper security. For instance, a CFO might automatically access financial metrics, while a marketing director sees campaign performance data - all from the same platform [1][3][9][12].
A standout example is JPMorgan Chase's adoption of an NLU-powered chatbot in 2025. This tool enabled executives to query complex financial data using natural language. The system automatically filtered results based on each executive's role, cutting down data analysis time by 40% [12][1].
Predictive Recommendations
Advanced NLP dashboards go beyond answering queries - they suggest follow-up metrics by analyzing how users interact across channels like email, chat, and voice. These systems infer intent and proactively recommend data that aligns with user goals [12].
According to Gartner, by 2026, 60% of executives are expected to use AI-enhanced dashboards, reducing manual analysis time by 40% [14]. For instance, if a Customer Success Manager often reviews churn rates after checking support ticket volumes, the dashboard learns to present both metrics together.
A real-world example of this is Bank of America's "Erica", an NLP-powered assistant integrated into their mobile platform. Erica's ability to learn customer behavior and suggest financial actions led to a 30% drop in call center volume and a 25% boost in mobile engagement [12][9].
"Business intelligence provides the context - and NLP provides the content." - Sarah O'Brien, VP of Go-to-Market Analytics, ServiceNow [12]
The evolution from static dashboards to intelligent, personalized interfaces marks a major shift in how businesses engage with data. These systems guide users based on their roles, behavior, and goals, eliminating the need to know exactly what to ask. This level of personalization sets the stage for further advancements, such as real-time alerts and voice-activated queries in modern BI tools.
Improving Alerts and Real-Time Interactions
Let’s dive deeper into how NLP transforms alerts and real-time interactions within BI dashboards. Traditional alerts often lack depth, offering generic notifications like "sales are down." NLP takes these alerts to the next level by delivering detailed narratives. For instance, instead of a simple sales decline alert, users might see explanations pointing to regional market shifts, underperforming products, or seasonal trends. These enriched alerts don’t just inform - they explain the "why" behind the numbers, making them far more actionable [2].
Voice and Text Inputs for Real-Time Queries
Voice-activated analytics are becoming a game-changer, especially in industries like finance. Imagine a trader asking, "What’s our exposure to tech stocks this morning?" and getting an instant response - no keyboard needed. This hands-free approach slashes the time it takes to get insights from 45 seconds down to just 8 seconds [5]. Over the course of a day, this can save enterprise users anywhere from 40 to 60 minutes compared to navigating traditional dashboards with filters and menus [15].
This speed advantage is particularly crucial during high-pressure moments. Take tools like Grafana Assistant, for example. Engineers can ask natural-language questions about system health directly within Slack, avoiding the need to switch between multiple tools. Dashboard links even expand into preview cards within the chat, providing immediate visual context when time is of the essence [2].
Context-Aware Alerts and Follow-Ups
Beyond rapid responses, NLP significantly improves follow-up interactions by retaining the context of ongoing queries. Let’s say a dashboard highlights an anomaly. Users can seamlessly ask follow-ups like "Drill into the West region" or "Compare with last year" without having to rephrase their initial question. This continuity ensures smoother, more intuitive interactions [2].
Another key feature is role-based access to alerts. For instance, a sales manager might see performance updates, while sensitive data like salaries remains restricted based on permissions. These tailored alerts not only enhance security but also drive engagement. Organizations using NLP-powered analytics report that 82% of employees actively engage with data analysis, compared to just 27% with traditional BI tools [15]. This surge in engagement is largely due to alerts that explain the "why" behind the data, offering more than just surface-level insights.
"A semantic layer provides a bridge between the language of business and the language of data." – Mark Palmer, Board Member, AtScale [1]
NLP doesn’t stop at internal metrics. It also tracks unstructured data sources like social media, customer reviews, and emails, alerting businesses to real-time sentiment changes. This broadens the scope of BI, helping organizations capture external signals that conventional dashboards often overlook [2].
Implementing NLP in BI Dashboards
After transforming BI dashboards with personalized insights and automated narratives, the next step is making sure NLP is implemented effectively to maximize its potential.
To get started, strategic planning is crucial. Your data should reside in modern cloud warehouses like Snowflake or BigQuery, organized in a star schema with clear table relationships [1][17]. This structure ensures your data is ready for NLP integration.
Begin by evaluating your current setup and pinpointing the 20–50 most critical business metrics. Get executive approval on their definitions [20] - this is vital to avoid confusion over terms like "revenue." Skipping this step can lead to major setbacks; in fact, 60% of AI projects fail because the data wasn't prepared for AI use [19].
Integrating a Semantic Data Layer
A semantic layer is a critical component for NLP success. It translates raw database data into everyday business terms, eliminating the need for users to grapple with complex SQL joins. For example, it can transform terms like "Customer Churn" or "Monthly Recurring Revenue" into optimized database queries [20][22]. Without this layer, AI systems risk producing flawed SQL queries or generating inaccurate results [18][19].
"A semantic layer is not just about standardizing metrics - it's about making data truly accessible." – Andrew Brust, Founder and CEO, Blue Badge Insights [21]
Technically, a semantic layer includes a modeling language (such as LookML, YAML, or AML), a SQL transpiler to convert natural language into database queries, and a metadata catalog for tracking data lineage [18][22]. Companies with robust semantic layers report an 80% drop in ad-hoc requests to data teams and a 50% reduction in BI costs [19]. To ensure version control and auditing, use tools like Holistics, Looker, or dbt that support Git integration [18][19].
Standardizing naming conventions is another key step. Rename tables and columns to plain English (e.g., change "DimCustomer" to "Customer") and add 3–5 synonyms for key concepts [23][2]. For instance, "Revenue" might also map to "sales", "bookings", and "earnings." This linguistic groundwork accounts for about 80% of NLP success in BI environments [23].
Once your semantic layer is set up, validate its performance with thorough testing.
Testing and Optimization
Testing is where the rubber meets the road. Start by running 20–50 common user questions through the system [24]. Track which queries succeed and why others fail. A well-prepared system should achieve an 80% success rate for natural language queries [23]. Modern LLM-based systems can reach 85–95% accuracy for frequently asked business questions [8].
To refine the system, consider a human-in-the-loop (HITL) approach. Add an "Edit spec" panel that allows users to correct misinterpreted queries [24]. These corrections can feed into the model, improving its performance over time through active learning. For queries with low confidence, use follow-up questions to clarify intent and improve completion rates [8].
Usage analytics are another valuable tool. Monitor failed queries to identify patterns and update your linguistic schema as needed [23][8]. Organizations that excel in NLQ implementation report a 68% reduction in time-to-insight and a 73% boost in active data users [8]. Roll out NLP features incrementally, focusing on one high-impact data domain at a time. This approach builds user trust and allows for gradual system improvements [23][8].
Once testing and adjustments are complete, specialized tools can help speed up your NLP deployment.
Leveraging Tools like QuantAIfy AI
If you're looking to fast-track your NLP implementation, tools like QuantAIfy AI can make a big difference. Available through The B2B Ecosystem (https://b2becosystem.com), these tools come with pre-built capabilities tailored for business growth analytics. They integrate seamlessly with your existing semantic layer, delivering faster query responses and more precise insights without requiring heavy customization.
These purpose-built solutions often include industry-specific language models already trained on common business terms. This minimizes the time spent on linguistic schema optimization and gets you to production faster. With 60% of new analytics spending projected to shift toward conversational AI interfaces by late 2026 [16], adopting the right tools now can give your organization a competitive edge.
Benefits and Comparison: Traditional BI vs. NLP-Enhanced BI
Traditional BI vs NLP-Enhanced BI Dashboards Comparison
Looking at how NLP-enhanced BI systems stack up against traditional BI, the differences go beyond just upgrades - they represent a fundamental shift in how businesses interact with data.
Traditional BI tools often demand users adapt to rigid frameworks, requiring technical skills like SQL or long waits for IT teams to deliver custom reports. In contrast, NLP-enhanced systems empower users to ask questions in plain English and get answers almost instantly. For example, JPMorgan Chase implemented an NLU-powered chatbot for their BI platform in 2025, cutting executive data analysis time by an impressive 40% [12].
Speed is another major differentiator. Traditional BI systems can take up to 45 seconds for simple queries and over five minutes for complex analyses. NLP systems? They deliver results in seconds. Power Digital Marketing experienced this firsthand when John Saunders, their VP of Product, oversaw the integration of Snowflake Cortex into their platform, achieving a 30x increase in speed to insights [9].
"The uncomfortable truth: dashboards are becoming obsolete. Not because they're bad, but because natural language analytics is fundamentally better for how people actually work with data." - Claire, Co-founder & CEO, nao [5]
Accessibility is another game-changer. While traditional BI systems struggle with adoption rates, hovering at just 25% despite massive investments [13], NLP-enhanced tools break down barriers for non-technical users. Teams in Marketing, HR, and Sales can now perform self-service analytics without delays, saving an average of 7–10 hours weekly, making decisions five times faster, and uncovering insights 40% faster than with traditional methods [9]. Bank of America demonstrated this with their "Erica" NLP assistant, which reduced call center volume by 30% and boosted mobile engagement by 25% [9].
Here’s a side-by-side look at how these systems differ:
Comparison Table: Traditional BI vs. NLP-Enhanced BI
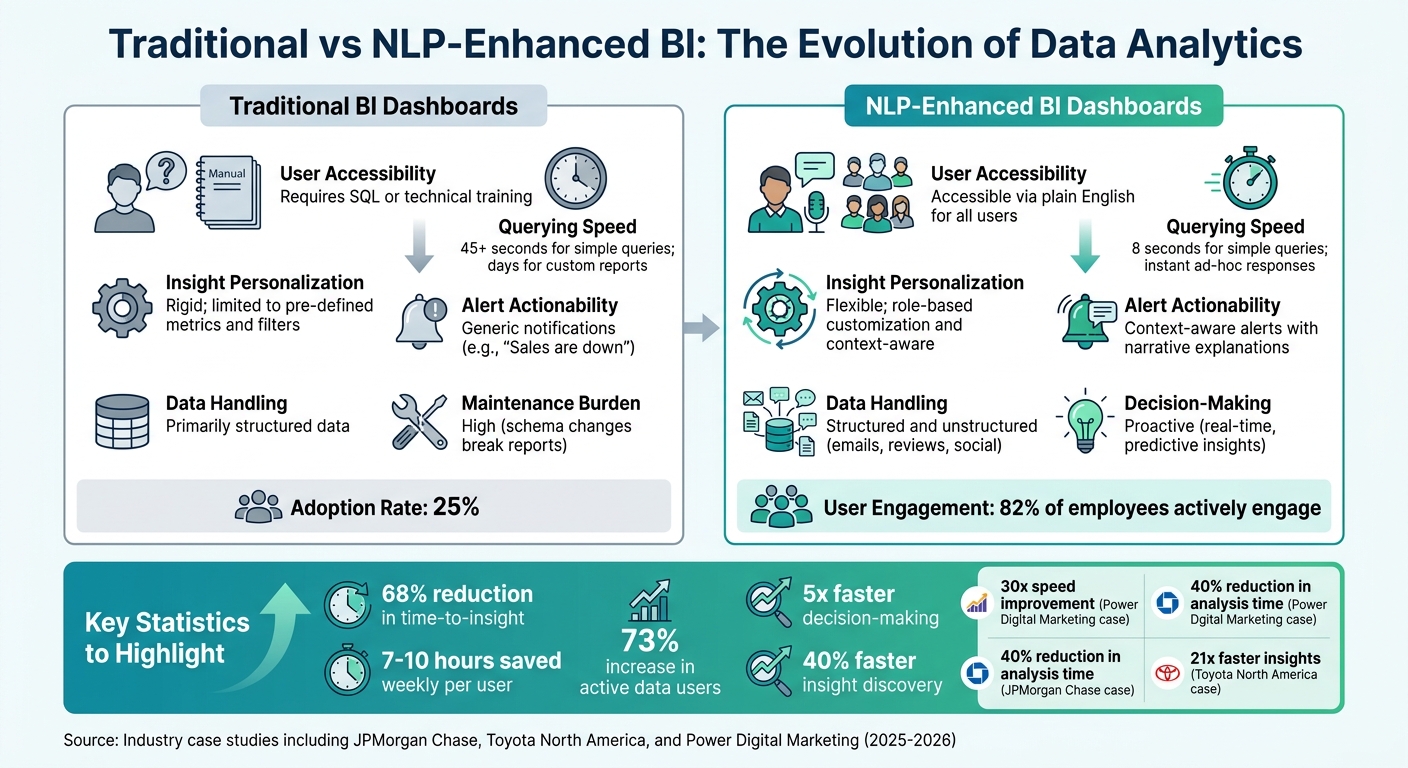
| Feature | Traditional BI Dashboards | NLP-Enhanced BI Dashboards |
|---|---|---|
| User Accessibility | Requires SQL or technical training | Accessible via plain English for all users |
| Querying Speed | 45+ seconds for simple queries; days for custom reports | 8 seconds for simple queries; instant ad-hoc responses |
| Insight Personalization | Rigid; limited to pre-defined metrics and filters | Flexible; role-based customization and context-aware |
| Alert Actionability | Generic notifications (e.g., "Sales are down") | Context-aware alerts with narrative explanations |
| Data Handling | Primarily structured data | Structured and unstructured (emails, reviews, social) |
| Decision-Making | Reactive (based on historical reports) | Proactive (real-time, predictive insights) |
| Maintenance Burden | High (schema changes break reports) | Low (centralized semantic logic) |
The advantages of NLP-enhanced BI go beyond operational performance - they also deliver measurable financial benefits. Delays in accessing data can cost companies up to 5% of their annual revenue due to missed opportunities [13]. Additionally, 58% of business decisions are still based on instinct rather than data, costing organizations an average of $12.9 million annually [13]. NLP-enhanced systems help close these gaps by reducing decision-making cycles by 60–80% compared to traditional batch-processed reports [13].
Toyota North America offers a compelling example. By deploying a Natural Language BI system with a semantic layer across 35+ subsidiaries in 2025/2026, they accelerated data insights by 21 times while also slashing infrastructure costs [1]. This illustrates how NLP-enhanced BI doesn’t just improve data accessibility - it transforms how businesses operate and compete.
Conclusion
NLP-powered BI dashboards are breaking down technical barriers, allowing marketing teams, sales leaders, and HR professionals to ask questions in plain English and get answers in seconds - no SQL expertise needed. This shift turns data from a tool reserved for analysts into something everyone can use to make faster, smarter decisions.
The results speak for themselves. Companies using NLP report saving 7–10 hours per week per user, making decisions five times faster, and uncovering insights 40% faster compared to traditional methods [9]. These efficiency gains are reshaping how businesses operate.
To fully unlock these benefits, it’s essential to lay the groundwork. Start with a semantic layer that ensures consistent metrics across the organization. Simplify your data warehouse with clear naming conventions, and choose tools that provide transparent SQL lineage and data provenance to build trust in your analytics. Gartner estimates that by late 2026, AI-driven insights will account for 60% of new analytics spending [16]. The momentum is undeniable - acting now puts you ahead of the curve.
For businesses ready to embrace this change, having the right tools and guidance is key. The B2B Ecosystem offers resources to make this transition seamless. Tools like QuantAIfy AI deliver tailored solutions for growth, such as the TAM Analyst for in-depth market analysis and the AI Process Optimizer to modernize outdated workflows. Paired with consulting services for strategic planning and implementation, these resources eliminate the guesswork from adopting NLP-enhanced BI. Visit https://b2becosystem.com to start turning your data into a competitive edge.
The real question isn’t whether to adopt NLP-enhanced BI - it’s how quickly you can implement it before your competitors take the lead.
FAQs
What data setup is needed before adding NLP to a BI dashboard?
Before adding NLP capabilities to your BI dashboard, it's crucial to ensure your data is in top shape. Start by making sure your data is well-structured and easy to access. Connecting your BI system to live data sources like Snowflake or BigQuery allows for real-time insights, keeping your analysis up-to-date.
Next, create a semantic layer to bridge the gap between business terms and their corresponding data definitions. This step ensures clarity and consistency across your dashboard.
Don't overlook data governance and security - these are critical for safeguarding sensitive information. A clean, organized, and secure data environment lays the groundwork for successfully integrating NLP into your BI tools.
How do I keep natural-language answers accurate and consistent across teams?
To maintain precision and uniformity in natural-language processing (NLP) within business intelligence (BI) systems, a few key practices come into play:
- Establish strong data governance: This ensures that data is managed, organized, and used responsibly across the organization.
- Develop clear business glossaries: A well-defined glossary helps align technical data with business terminology, reducing any confusion.
- Structure metadata effectively: Properly organized metadata provides context, making data easier to interpret and use.
Additionally, using semantic layers can bridge the gap between technical data and business language, simplifying complex datasets into terms that make sense to end users. To keep everyone on the same page, regular training sessions and up-to-date documentation are essential. These resources clarify data definitions and standardize query practices, helping teams maintain clarity and consistency in NLP-driven BI tools.
How can I test and improve natural-language queries after launch?
To make natural-language queries better after launch, pay close attention to how users interact with the system. Look for errors or areas where queries seem unclear, and gather feedback about how accurate the results feel to users. Keep an eye on performance metrics, such as how relevant the results are and how quickly they load.
It's also important to refine the system's semantic layer by ensuring business terms are well-defined and easy to understand. Regularly update your data governance practices and metadata to keep everything aligned. Finally, test real user queries in an ongoing way to fine-tune NLP models, helping them better understand and deliver the results users expect.