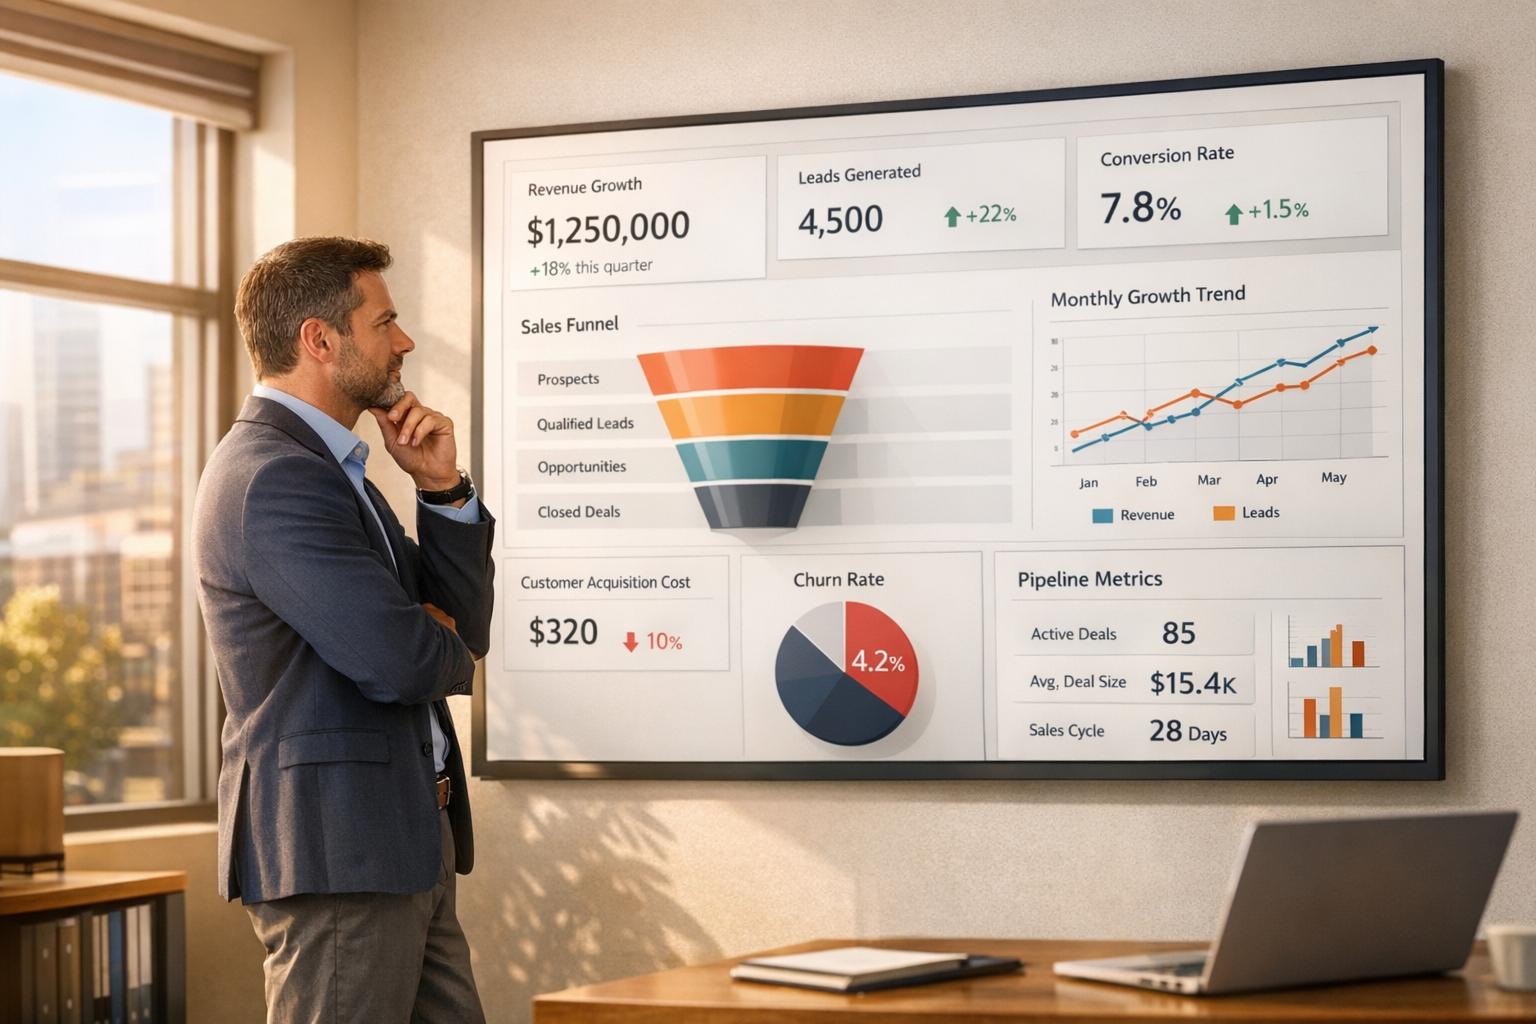
Cohort analysis helps CFOs in subscription-based businesses uncover customer behavior patterns that drive revenue growth. Instead of analyzing all customers as one group, it segments them into smaller, meaningful groups (cohorts) based on shared traits like signup date or behavior. This method reveals trends in retention, churn, and expansion revenue that traditional reporting often misses.
Key Benefits of Cohort Analysis for CFOs:
- Boost Retention: Tailored strategies can improve retention rates by up to 20%.
- Accurate Forecasting: Predict revenue trends more reliably by analyzing cohort-specific data.
- Identify Churn Causes: Spot which customer groups are leaving and why.
- Measure ROI of Changes: Compare cohorts before and after pricing or product updates.
- Save Time: Automate reporting and reduce manual data analysis.
Quick Insights:
- Behavioral and time-based cohorts provide different perspectives on customer value.
- Metrics like retention rate, expansion revenue, and churn rate are crucial for tracking financial health.
- Combining cohort insights with financial planning cycles (monthly, quarterly) enhances decision-making.
By integrating cohort analysis into financial reporting, CFOs can shift from reactive to proactive strategies, driving smarter decisions and long-term growth.
Do I Need Cohort Analysis for My Revenue Streams? | SaaS Metrics School | Cohort Analysis
Building Cohort Analysis Frameworks for Financial Planning
Expanding on the basics of cohort analysis, CFOs can craft frameworks that link customer behavior to financial outcomes, offering actionable insights for financial planning. These frameworks are designed to answer specific financial questions while integrating smoothly with regular reporting cycles.
Steve Groccia, Head of Customer Operations at Mosaic, highlights a common hurdle:
"It takes a lot of time, resources, and energy to just set up the data in a way that would actually make it usable and make it work"
The key is to start with clear financial goals. Before diving into data, CFOs should pinpoint the exact questions they need answered. Are you analyzing which acquisition channels yield the highest lifetime value? Estimating cash flow from current customer cohorts? Or gauging the financial effects of product changes on different customer segments?
Once these objectives are defined, the framework becomes more streamlined. Start by gathering essential data: revenue figures (tied to purchase dates), unique customer identifiers, and customer start dates. This foundational dataset allows you to track financial metrics across customer groups effectively.
Aligning Cohorts with Financial Timelines
For cohort analysis to truly support financial planning, it must align with your company’s planning cycles. If your organization operates on quarterly cycles, structure cohorts to deliver insights that directly inform quarterly forecasts and budget reviews.
For instance, you can create monthly cohorts and then aggregate them into quarterly views. This provides detailed insights while staying compatible with standard financial reporting. For example, track customers who joined in January, February, and March 2024 separately, then combine their data to analyze Q1 2024 trends.
If you operate on annual cycles, quarterly cohorts can reveal seasonal patterns and year-over-year performance trends. This is particularly useful for subscription-based businesses with seasonal fluctuations, as it helps predict how Q4 cohorts might perform compared to Q2 cohorts, aiding in cash flow planning and resource allocation.
Timing is equally critical for cash flow analysis. Align your cohort structure with customer payment cycles. For annual payment models, build cohorts that track performance over 12 months. For monthly subscriptions, focus on the first 90 days, as this is when churn typically peaks. By syncing cohort data with financial planning cycles, you can automate reporting processes and reduce manual efforts.
Behavioral vs. Time-Based Cohorts
Choosing between behavioral and time-based cohorts can significantly influence the depth of your financial insights. Each approach serves a different purpose and uncovers unique revenue patterns.
Time-based cohorts group customers based on when they started using your service. These cohorts highlight seasonal trends and market influences on customer value. For example, when tracking metrics like Average Revenue Per User (ARPU), time-based cohorts can reveal if recent customers are more or less valuable than earlier ones. This approach is particularly helpful for cash flow forecasting, as early customer behavior often predicts future revenue.
Behavioral cohorts, on the other hand, group customers based on their actions or shared characteristics. Examples include customers who upgraded within 30 days, those acquired through specific channels, or distinctions like enterprise versus SMB customers. Behavioral cohorts excel at measuring Customer Lifetime Value (CLTV), as they show how particular actions impact long-term value. For ARPU analysis, they identify which behaviors lead to higher revenue per user, helping to shape customer success strategies and allocate resources more effectively.
For the most comprehensive insights, combine both approaches. For instance, create time-based cohorts for customers who joined in Q1 2024, then segment each by behavior, such as product usage or upgrade trends. This dual approach uncovers both temporal patterns and behavioral drivers of revenue growth.
Here’s a comparison of these approaches:
| Cohort Type | Best for Tracking | Key Financial Insight | Example Use Case |
|---|---|---|---|
| Time-based | ARPU trends, seasonal patterns | How market conditions affect customer value | Comparing Q4 vs. Q1 customer performance |
| Behavioral | CLTV, feature impact | Which actions drive long-term value | Analyzing customers who upgrade early |
| Combined | Comprehensive revenue analysis | Interaction effects between time and behavior | Q1 enterprise customers vs. Q1 SMB customers |
While behavioral cohorts require more complex data collection, they often yield more actionable insights. For SaaS businesses, understanding what drives product stickiness can directly improve long-term financial outcomes. Behavioral cohorts reveal which features or experiences foster loyalty, translating into better financial performance over time.
Key Metrics to Track Revenue Growth Using Cohort Analysis
To effectively link customer behavior to financial results, it's crucial to focus on metrics that directly influence financial performance. Metrics like retention rate, revenue per user, upgrade rate, and expansion revenue provide CFOs with actionable insights to refine forecasts and drive growth. These indicators bridge the gap between customer behavior and strategic financial decisions.
Retention and Churn Rates
Retention and churn rates are essential for understanding revenue stability, especially in subscription-based businesses. Through cohort analysis, these metrics reveal which customer groups are likely to stay engaged and contribute to long-term revenue growth.
For example, if 100 customers sign up in January 2024 and 85 are still active six months later, the cohort's six-month retention rate is 85%. Tracking these rates over time can uncover trends or potential red flags.
In the tech industry, monthly churn rates typically range from 5% to 7%, while SaaS companies aim for retention rates of 80% or higher. Enterprise tech companies often see churn rates between 3% and 5%, with retention rates ranging from 85% to 95% over a 12-month period. Netflix, a standout example, had 232.5 million paid subscribers in Q1 2023, maintaining a churn rate of just 2%, far below the industry average of 6-8%.
Cohort tracking also enables early detection of issues. For instance, if a new cohort shows lower retention compared to earlier groups, it might indicate problems with product updates, market shifts, or the quality of customer acquisition efforts.
A case in point is CodeSpark, which improved retention by segmenting users based on acquisition sources. By conducting A/B tests on features with different cohorts, they discovered that users from their Hour of Code program had different behaviors than those from school programs. This insight helped them retain students for longer periods.
Cohort-specific insights can also guide resource allocation. For example, if email campaign-acquired customers stay 40% longer than those from social media, acquisition strategies can be adjusted accordingly. Even a modest 5% reduction in churn can potentially double profitability over time, making retention improvement a high-priority area for CFOs.
Expansion Revenue Trends
Retention metrics are just one piece of the puzzle. Expansion revenue, which measures growth within existing customer relationships, is another critical factor. Cohort analysis helps identify which customer groups are most likely to increase their spending through upgrades, additional purchases, or added users.
Tracking monthly recurring revenue (MRR) for each cohort provides insights into customer expansion trends. This goes beyond retention to highlight revenue growth opportunities within the customer base.
Steve Wolfe, co-founder of Growth Street Partners, underscores the predictive nature of expansion metrics:
"Cohort renewal rate is mostly backward looking, while the upsell rate is predictive. A cohort with a higher upsell rate should have a higher expected renewal rate, as customers who purchase additional products and services are more likely to renew."
To calculate upsell rates, measure the percentage of customers purchasing additional services over specific time frames. For instance, some cohorts might double in size within the first year, which should be factored into future revenue projections.
Kevin Xo, Senior Associate at Growth Street Partners, highlights the importance of historical data:
"Historical trends can help us confidently predict key MRR drivers such as expansion, contraction, and churn of current and future cohorts."
Breaking down cohorts by factors like acquisition source, pricing plan, company size, or industry can provide even deeper insights. For example, enterprise customers often show different expansion behaviors compared to small and medium-sized businesses, enabling more targeted resource allocation and sales strategies.
Ticketmaster leveraged cohort segmentation to optimize its B2B marketing. By creating distinct cohorts for venues, artists, and promoters, and tailoring personalized messaging through A/B testing, they significantly boosted their marketing ROI.
Monitoring contraction - when customers downgrade their plans or reduce usage - is equally important. It provides early warnings of potential issues and informs pricing adjustments. Companies that optimize pricing based on cohort analysis often achieve 20-30% higher net dollar retention compared to industry averages.
Regular updates to cohort analysis, ideally on a monthly basis, ensure that changes and trends are continuously monitored. Incorporating these findings into budgeting and forecasting processes allows revenue projections to be based on the historical patterns of similar cohorts rather than relying solely on overall growth rates. This dynamic approach equips CFOs to adapt strategies in real time.
sbb-itb-01010c0
Advanced Segmentation Methods for Cohort Analysis
Expanding on the basics, advanced segmentation takes cohort analysis to the next level by diving deeper into customer behaviors and their financial impact. By leveraging these methods, businesses can uncover patterns that reshape revenue strategies and improve resource allocation. Below, we’ll explore segmentation by customer size and techniques for predicting churn to gain sharper revenue insights.
Enterprise vs. SMB Cohorts
Segmenting customers by size reveals critical financial differences that can guide strategic decisions. Enterprise and SMB customers operate on vastly different timelines and contribute differently to the bottom line, so lumping them together can distort budgeting and planning.
Enterprise customers often come with longer sales cycles - typically over 180 days - and average contract values starting at $50,000 per subscription. These deals usually require customization, involve multiple stakeholders, and often bundle software with professional services. The median operating expense per enterprise customer hovers around $89,000, a cost offset by their higher revenue potential.
On the other hand, SMB customers tend to make quicker, transactional purchases with smaller contract values and fewer customization needs. For SMBs, the median per-customer operating expense is about $18,700, calling for different marketing and lead generation strategies.
Tracking these segments over time highlights their distinct revenue trajectories. For instance, at the $60 million revenue mark, enterprise-focused companies often achieve growth rates near 50%, compared to around 34% for SMB-focused models. However, SMB models typically enjoy gross margins about 10 percentage points higher than their enterprise counterparts.
| Customer Type | Sales Cycle | Average Contract Value | Operating Expense per Customer | Revenue Growth Rate |
|---|---|---|---|---|
| Enterprise | 180+ days | $50,000+ | $89,000 | ~50% |
| SMB | Transactional | Low | $18,700 | ~34% |
These insights help CFOs fine-tune pricing strategies for each customer type. Companies that adopt detailed segmentation strategies often achieve 10-15% higher realized prices compared to those using a one-size-fits-all approach. By monitoring pricing cohorts, businesses can identify and refine models that maximize long-term financial outcomes.
While size-based segmentation highlights financial disparities, similar approaches can predict and mitigate churn risks, adding another layer to strategic planning.
Predicting Churn Risk
Combining cohort analysis with behavioral data offers a powerful way to predict and address churn. Even a modest 5% boost in retention can lead to profit increases of up to 95%, illustrating the value of churn prediction models.
Behavioral cohorts dig into the reasons behind churn. Instead of grouping customers only by acquisition date, segmenting them based on in-product actions provides deeper insights. For example, customers who complete onboarding tend to show lower churn rates than those who don’t. Similarly, users who engage with key features are more likely to stick around.
"Cohort analysis can help you determine which cohorts/groups of customers are contributing the most to revenue." - Jonathan Parisot, co-founder and CEO at Actiondesk
Blending acquisition data with behavioral insights gives a fuller picture of churn. Start by asking targeted questions like, “When are customers most likely to churn?” or “What behaviors signal an increased risk of churn?” Use these insights to create cohort tables that track retention and churn rates over time.
Key retention drop-offs in these cohorts can pinpoint churn risks. Ideal churn rates vary depending on the business’s maturity - startups and SMBs should aim for 10-15%, while established enterprises target 5-7%.
Segmenting by Customer Lifetime Value (CLV) can further prioritize efforts on high-value customers. For instance, a fashion retailer increased annual revenue by 29% after launching campaigns tailored to purchase frequency, average order value, and product preferences. These efforts also boosted email click-through rates by 35%.
Regularly updating churn prediction models is crucial for staying effective. Monitoring metrics like reduced churn, improved retention, and higher CLV helps measure success. With 91% of consumers more likely to shop with brands offering personalized recommendations, retention strategies tailored to cohort insights can set a business apart.
To act on these insights, focus on targeted interventions for at-risk groups. For example, re-engage inactive users with personalized messages, improve underused features, and offer tailored support to address specific cohort challenges. These actions can significantly enhance long-term customer value.
Adding Cohort Analysis to Financial Reporting
Incorporating cohort analysis into financial reporting takes forecasting and strategic planning to the next level. Instead of treating cohort analysis as a standalone task, the best CFOs make it an integral part of their financial processes. This approach not only sharpens forecasting accuracy but also leads to smarter decision-making.
Some of the leading public companies are already setting the standard here. For instance, DataDog includes customer cohort analysis in its investor reports, showcasing seven years of cohort data in its S-1 registration statement and using it to evaluate ARR growth. Similarly, UiPath highlighted seven years of ARR growth from customer cohorts in its IPO filing, calculating ARR by annualizing the last month's GAAP revenue.
Cohort-Based Forecasting
Traditional forecasting methods often rely on overall growth rates, which can miss key insights. Cohort-based forecasting, on the other hand, digs deeper by analyzing patterns within specific customer groups. This method enables CFOs to better predict recurring revenue, track customer behavior, and fine-tune forecasts for renewals, churn, and customer lifetime value.
By identifying predictable revenue trends within cohorts, you can create more accurate revenue projections. To make this work, update your cohort analysis monthly and include essential metrics like retention rate, revenue per user, upgrade rate, and expansion revenue. This regular review helps you catch shifts in customer behavior early, allowing you to base projections on historical performance of similar cohorts rather than relying on aggregate growth rates.
Cohort forecasting is particularly useful when assessing the impact of business changes, such as pricing updates or product enhancements. By comparing cohorts before and after these changes, you can measure the actual return on investment (ROI) of your initiatives. These insights naturally translate into visual data that supports executive decision-making.
Visualizing Cohort Trends
Accurate forecasting is just one part of the equation - clear visualizations are essential to ensure stakeholders quickly understand cohort performance. Effective CFOs rely on specific chart types to make cohort data actionable for board meetings and strategic discussions.
For instance, retention curves are ideal for showing how different cohorts perform over time. A great example is BlackLine, a SaaS company targeting CFOs, which included a five-year customer cohort analysis of its subscription and support revenue in its IPO registration filing.
Heat maps are another powerful tool, making it easier to spot patterns and communicate cohort performance at a glance. They help identify which time periods or customer segments are thriving - or struggling - without needing to dive into dense data.
When sharing cohort findings, use a mix of retention curves, heat maps, and bar charts to highlight key trends. For example, Shopify regularly shares cohort analysis with investors, using bar charts to illustrate growth across four customer cohorts in its regulatory filings.
When presenting these visualizations, emphasize the key takeaways and provide context to ensure your team understands the broader implications. Train your analysts to interpret cohort patterns, paying close attention to sudden drops or spikes, and explain what these changes might mean for future performance.
The most effective strategies combine multiple visualization types. Use line charts to track trends over time, bar charts to compare cohorts side by side, and retention graphs to showcase user behavior patterns. Together, these tools create a complete picture that drives informed decision-making.
Conclusion: Driving Revenue Growth with Cohort Analysis
Cohort analysis offers CFOs a powerful way to reimagine revenue optimization and financial planning. Instead of relying on broad, surface-level data, it digs deeper to uncover the true drivers of customer behavior and revenue trends. Companies leveraging this approach have reported up to a 20% improvement in retention and the recovery of up to 5% of lost revenue.
The financial benefits go well beyond just better reporting. By understanding predictable patterns in customer behavior, CFOs can shift from reactive decision-making to proactive strategy. As Steve Groccia from Mosaic puts it: "It's table stakes just to know where you land, relative to other companies of your size. But to really understand the dynamics of it, that's where cohorting becomes very powerful because you could actually start to understand the 'why' behind your numbers".
Top-performing CFOs incorporate cohort insights into their monthly workflows, focusing on key metrics like retention rates, revenue per user, upgrade rates, and expansion revenue. These patterns guide critical decisions around budgeting, forecasting, and resource allocation. For instance, businesses have seen tangible results such as saving 32 hours per month through streamlined workflows and achieving a 60% increase in new user activation.
Regular updates are crucial. Cohort findings should be integrated into board presentations and used to test the impact of pricing adjustments, product enhancements, and customer acquisition strategies. Replacing aggregate growth rates with historical cohort performance sharpens forecasting accuracy and strengthens strategic planning.
For CFOs aiming to drive meaningful revenue growth, cohort analysis is a game-changer. By embedding these insights into routine financial reviews, leaders can refine strategies and achieve measurable results, as outlined in the methods discussed earlier.
FAQs
How can CFOs use cohort analysis to enhance financial reporting and drive revenue growth?
CFOs can use cohort analysis to group customers based on shared characteristics, such as when they were acquired, their subscription level, or purchasing habits. This method offers a clearer understanding of how various customer groups contribute to revenue over time. By zeroing in on metrics like Net Revenue Retention (NRR) and Customer Lifetime Value (CLV) within these groups, CFOs can spot trends that lead to more precise financial forecasts and better strategic decisions.
Incorporating cohort analysis into routine financial reports allows CFOs to pinpoint top-performing customer segments, allocate resources more effectively, and fine-tune retention strategies. For instance, examining revenue trends by cohort can highlight which groups are fueling growth, helping CFOs focus on initiatives that boost long-term profitability.
What’s the difference between behavioral and time-based cohorts, and how do they help analyze revenue growth?
Behavioral and time-based cohorts each offer unique ways to group users and uncover insights.
Behavioral cohorts focus on segmenting users based on their actions or habits, such as how frequently they use a product or specific features. This approach is particularly useful for identifying patterns in engagement, spotting loyal customers, and predicting potential churn. These insights are key for businesses aiming to improve user retention and boost long-term revenue.
In contrast, time-based cohorts group users by when they first interacted with or joined a business, like their sign-up month. This method is great for tracking trends over time, such as the effectiveness of a marketing campaign or seasonal shifts in revenue. For instance, comparing revenue from customers who signed up in January to those who joined in July can reveal how timing influences performance.
Both methods bring valuable perspectives: behavioral cohorts shed light on user engagement and retention, while time-based cohorts help analyze trends and evaluate the impact of time-sensitive strategies.
How does cohort analysis help CFOs reduce customer churn in subscription-based businesses?
Cohort analysis gives CFOs a powerful tool to tackle customer churn by breaking users into groups based on shared traits or behaviors - like the month they joined or how they use a product. Tracking these groups over time helps businesses pinpoint the moments or reasons customers are most likely to leave.
For instance, if a particular group tends to drop off during onboarding, companies can adjust their onboarding process or provide extra support to boost retention. On the flip side, cohort analysis can also reveal patterns tied to long-term loyalty, helping businesses focus on strategies that encourage those behaviors. With this data-driven insight, CFOs can make smarter decisions to improve customer satisfaction, cut churn, and build steady revenue growth.