Data-driven strategies are helping companies achieve measurable growth by solving common challenges like siloed data, inconsistent metrics, and inefficient processes. Here's what successful businesses are doing:
- Unified Metrics: Standardizing definitions (like churn or revenue) ensures teams make decisions based on consistent data.
- Automation: Automating manual tasks, like data quality checks or reporting, saves time and reduces errors.
- Cross-Functional Collaboration: Shared dashboards and unified reviews eliminate silos and foster accountability.
- Customer Insights: Combining behavioral data with feedback helps predict churn and personalize offers, improving retention.
- Operational Efficiency: Real-time monitoring and AI tools streamline workflows, cutting costs and boosting productivity.
Key Results:
- A SaaS company increased Net Revenue Retention from 95% to 108%, saving $1.2M in ARR.
- FedEx improved activation rates by 15% and achieved a 2,000% ROI with personalized campaigns.
- L'Occitane boosted post-purchase revenue by 235% using AI-driven refill reminders.
These examples highlight how disciplined data practices drive growth, reduce inefficiencies, and enhance customer engagement.
Data-Driven Growth: How to Unlock Market Opportunities
sbb-itb-01010c0
Data Governance: Setting Up a Reliable Data Foundation
Data strategies thrive on reliable numbers. Without clear guidelines about who owns the data, how it's defined, and how it's maintained, even the most advanced analytics tools can fall short. Companies making the most progress aren't chasing perfection overnight - they're taking small, deliberate steps that gradually strengthen their data foundation.
Shared Ownership of Data
One common mistake in governance is treating data as just an IT responsibility. When ownership is unclear, management suffers. The most effective companies tackle this by assigning domain stewards in areas like Finance, Sales, or Product. These stewards take responsibility for the accuracy and consistency of data within their respective domains.
Deutsche Börse provides a great example with its federated governance model. Here, a central team sets the standards ("the what"), while local domain teams focus on execution ("the how"). Shraddha Sharma, VP of Project Management for Data Governance at Deutsche Börse, explains the importance of this balance:
"Data cataloging is not an easy task. It needs human efforts and domain expertise. We needed to have business alignment and prioritization before we decided what goes into the catalog and for what purpose."
This model avoids the bottlenecks of centralized control while ensuring everyone stays aligned on definitions and quality.
Maintaining Data Quality
Bad data is expensive. U.S. businesses lose roughly $3.1 trillion each year due to poor CRM data alone. On the flip side, organizations with strong governance frameworks can improve reporting accuracy by up to 40%. The difference often boils down to how proactively data pipelines are tested and validated.
Top-performing teams rely on automated data quality testing. By running checks during every pipeline execution, they catch issues early - before they can impact decisions. For instance, a $25M ARR B2B SaaS company implemented 340 automated data quality tests with dbt, achieving 100% executive dashboard adoption and eliminating shadow reporting in spreadsheets. Similarly, a mobile commerce platform removed over 6,200 defects from production reporting tables during a data foundation rebuild, cutting manual reconciliation efforts by over 90%.
The key is simple: define metrics like "churn" or "net revenue" in one place, using code, and manage them with version control tools like Git. When everyone pulls from the same definitions, teams avoid conflicting interpretations and ensure consistency.
Once data quality is addressed, the next step is uniting business and IT teams to maximize value.
Aligning Business and IT Teams
After ensuring data accuracy, bridging the gap between technical and business teams becomes critical. Across various case studies, the biggest successes came not from adopting new tools but from aligning both sides on what the data means before building solutions. This alignment is the final piece of a reliable data foundation.
Georgia-Pacific highlights this approach well. Under the leadership of VP of Data Matt Robuck, the company developed "GP Data Pulse" using Alation. By connecting data quality tools directly to the platform and documenting lineage across more than 30 data sources, they achieved cleaner data and saved $25 million in a single year. Procurement managers, confident in the inventory data, began sourcing spare parts internally instead of buying new ones. Robuck sums it up perfectly:
"If I talk to my executive team about data platforms, it can be a tough discussion. But if I talk to them about how we're moving the P&L with data, they listen."
Cross-Functional Decision-Making: Removing Departmental Silos
Once data governance is in place and business and IT teams are working together, the next challenge is eliminating departmental silos. Silos can hinder progress, even when your data is clean. Imagine this: Sales is working off one set of numbers, Finance is tracking another, and Product is building from a third. The result? Duplicated efforts, blame games, and decisions based on incomplete information. Fixing this problem isn’t just about fostering collaboration - it requires creating a unified structure.
Shared Dashboards
A powerful way to break down silos is by giving every team access to a shared view of the data. When departments like Marketing, Sales, and Customer Success rely on the same data source with consistent metrics, the conversation shifts from "Whose data is correct?" to "What actions should we take?"
Take the example of a $25M ARR B2B SaaS company. Initially, their dashboard adoption was under 30%, and teams couldn’t even agree on a churn definition. But after rolling out 24 self-serve dashboards with 45 standardized metrics, executive dashboard usage hit 100%, and ad-hoc data requests dropped by 60% - all within six weeks. By defining key metrics like ARR, churn, and CAC in a single, versioned repository, they avoided the problem of different teams reporting conflicting numbers for the same metric.
"The difference isn't the tools - it's that everyone now trusts the same numbers, can access them without filing a ticket, and makes decisions based on evidence instead of intuition." - VP of Data, B2B SaaS Platform
Once teams share a unified data view, establishing collective review mechanisms ensures accountability across the board.
Unified Performance Reviews
While shared dashboards unify data perspectives, unified performance reviews ensure that accountability is shared as well. Incorporating shared scorecards into weekly reviews shifts the focus from isolated metrics to collective outcomes.
Consider Velosian, a B2B SaaS company that grew from 60 to 320 employees between 2022 and 2025. They initially struggled with disconnected systems, inconsistent lead definitions, and a 60% forecast variance. After consolidating their tools into a single HubSpot instance with standardized deal stages and entry/exit criteria, they reduced forecast variance to under 9% in just two forecast cycles and increased pipeline velocity by 41%. Weekly revenue reporting, which had previously taken three days, became automated and real-time.
"I'd stopped putting pipeline numbers in front of the board because I couldn't defend them. Within two forecast cycles... our variance was under 9%. The board started trusting the numbers again." - VP of Revenue Operations, Velosian
These efforts lead to measurable improvements in operational metrics, as detailed below:
| Metric | Before | After |
|---|---|---|
| Forecast Variance | 60% | <9% |
| Dashboard Adoption | <30% | 100% |
| Ad-hoc Data Requests | ~80% of analyst time | 60% reduction |
| Revenue Reporting Time | 3 days/week | Automated, real-time |
| Net Revenue Retention | 95% | 108% |
These examples prove that true alignment doesn’t come from more meetings or complex communication strategies. Instead, it happens when every team starts with the same data, reviews it on the same schedule, and shares responsibility for the outcomes.
Customer Insights and Personalization: Mapping the Customer Journey
Unified dashboards and shared accountability help solve internal alignment issues, but real growth comes from predicting customer behavior - especially before they churn. To do this, companies need to blend behavioral signals, transaction history, and direct feedback into a clear, actionable view of each customer.
Behavioral and Transactional Data
The most forward-thinking companies are moving beyond static customer segments and focusing on real-time data from individual interactions. This means analyzing what customers buy, how often they engage, and when they stop participating.
Take FedEx as an example. They unified an enormous amount of daily operational data - one petabyte, to be exact - using Salesforce Data 360. This system identifies when a customer signs a contract but doesn't ship, automatically triggering a personalized reactivation campaign. The results speak for themselves: customer activation rates jumped from 25% to 40%, and the system now powers over a billion personalized emails every year. Dormant account reactivation alone has delivered a staggering 2,000% ROI.
In B2B industries, tracking feature usage often provides a more reliable indicator of churn than simply monitoring login frequency. For instance, platforms that measured how many core features customers utilized improved churn prediction accuracy from 30% to over 80%. This shift highlights the importance of prioritizing onboarding and customer success efforts based on meaningful engagement metrics.
"It's imperative that we deliver the right amount of data and context to each employee at the right time. Being able to target the right customers... is going to help us anticipate and adapt to market trends." - FedEx Leadership
While behavioral data offers valuable insights, direct customer feedback plays a critical role in shaping product improvements.
Using Customer Feedback to Refine Offerings
Successful companies don't just collect customer feedback - they act on it quickly. Hapag-Lloyd, for example, leveraged Amazon Bedrock and Elasticsearch to automate the analysis of over 15,000 customer feedback items per month. This system achieved 95% accuracy in sentiment classification. Instead of waiting weeks for manual reviews, the company aggregates feedback trends biweekly to guide product development. Two frequent complaints - difficulty submitting shipping instructions and manually entering cargo data - led to the creation of a "Preview" functionality and an Excel upload feature.
Tree Hut provides another compelling example. By analyzing thousands of social media comments and DMs with AI, they identified a strong demand for their seasonal "Cinnamon Dolce" scrub. This insight allowed them to expand the product into a full line, including body lotion and body wash, which they later showcased in a Super Bowl ad.
"With AI, we could finally quantify the demand... That allowed us to line up those insights with our spring launch and actually expand [the product] into more formats." - Sarah Craig, Associate Director of Integrated Media, Naterra (Tree Hut)
Personalized Offers and Customer Retention
Once companies refine their customer insights through behavioral data and feedback, they can create highly tailored retention strategies. L'Occitane, for example, replaced fixed replenishment schedules with an AI-driven system that calculates the consumption speed of individual products for each customer. This system sends "Need a refill?" emails precisely when customers are likely running low, leading to a 235% increase in post-purchase revenue within 21 days - without using discounts.
Casey's General Stores applied a similar approach but on a much larger scale. Under the leadership of Art Sebastian, VP of Digital Experiences, the company transitioned from sending 300,000 monthly batch emails to delivering 170 million personalized messages. By tailoring offers to each customer’s purchase history - like sending a free breadsticks offer to someone who frequently buys pizza - they achieved a 16% increase in pizza conversions. Additionally, they can now build customer segments 30 times faster than before.
"Replenit transformed our CRM in just 3 weeks. It generated incremental revenue and boosted lifecycle results by 235%, all without any discounts." - Pinar Akcam, CEO, L'Occitane en Provence
The takeaway is clear: when offers are based on real customer behavior rather than arbitrary schedules, conversion rates and satisfaction improve - without having to rely on profit-cutting discounts.
Operational Optimization and Automation: Cutting Friction and Saving Time
Operational efficiency is the backbone of digital growth. By cutting down on friction and saving time, businesses can unlock new levels of productivity. And at the heart of this transformation? Data discipline. It’s the key to eliminating bottlenecks and taking manual tasks out of the equation.
Redesigning Processes with Data Insights
Take FedEx as an example. In 2026, Senior VP Rachel Skaff spearheaded a major overhaul of their marketing processes. The company replaced over 24 manual intake forms with a single, AI-powered work orchestration system built in Asana. The results were astounding: over 1,200 hours saved annually on content development, 300 hours cut from manual reporting, and a ninefold increase in speed-to-market.
"The biggest game-changer is leveraging Asana AI Teammates to automatically generate business documents from information captured directly in the workflow... compressing planning timelines from weeks to days." - Jessica Rogers, Digital Marketing Principal, FedEx
This kind of process redesign shows just how much efficiency can be gained when data insights reshape workflows.
Automating Routine Tasks
Automation takes efficiency to another level by handling repetitive tasks. Covestro provides a great example. Their master data management process used to take 12 hours per material record due to manual, email-heavy workflows. In 2026, Christian Jantzen led the implementation of MARIS, an AI agent built on Amazon Bedrock. The result? A staggering reduction in cycle time - from 12 hours to just 6 minutes, slashing 99% of the effort.
"Our AI agent MARIS has transformed our approach to material master data maintenance by providing instant, conversational access to complex processes. We are now available to our stakeholders 24/7, with no waiting times and no manual dependencies." - Sunny Liu, Global Process Owner for Material Master Data, Covestro
Meanwhile, C.H. Robinson tackled inefficiencies in logistics. By deploying LangChain-powered AI agents to interpret inconsistent email formats, they automated the creation of 5,500 shipments daily. This saved more than 600 hours of manual labor every single day.
These examples highlight how automation doesn’t just save time - it frees up resources for more impactful work.
Real-Time Performance Monitoring
Switching from static reports to live dashboards can revolutionize decision-making. Morrisons, a UK supermarket chain, transitioned its data infrastructure to Google BigQuery and Looker. This upgrade reduced reporting lag from 24 hours to just 15 minutes - a 98.96% improvement. Store managers, who once relied on outdated data, now make immediate, informed decisions about inventory.
"The difference between then and now is like night and day. When we started, our data scientists had to wait to access the data each day. Now, not only can the data scientist access it in real time, our business colleagues can too." - Peter Laflin, Chief Data Officer, Morrisons
Mercado Libre also leaned into real-time monitoring to solve courier availability issues. Using Amplitude AI agents and dashboards, they pinpointed areas where sellers struggled to find couriers. By onboarding new partners in these zones, they improved their service level agreement (SLA) by 2.5% and reduced search dropoffs by around 10%.
"Having an AI Agent that proactively sends us insights and highlights areas to review has helped us react quickly and anticipate potential issues before they escalate." - Matias Caratti, Product Shipping Supervisor, Mercado Libre
The takeaway is clear: combining automation with real-time visibility transforms operations. By replacing slow, manual processes with data-driven workflows, businesses are achieving efficiency gains that were once unimaginable. These strategies are driving operational breakthroughs for forward-thinking enterprises featured on The B2B Ecosystem.
Growth Outcomes: Results from Data-Driven Strategies
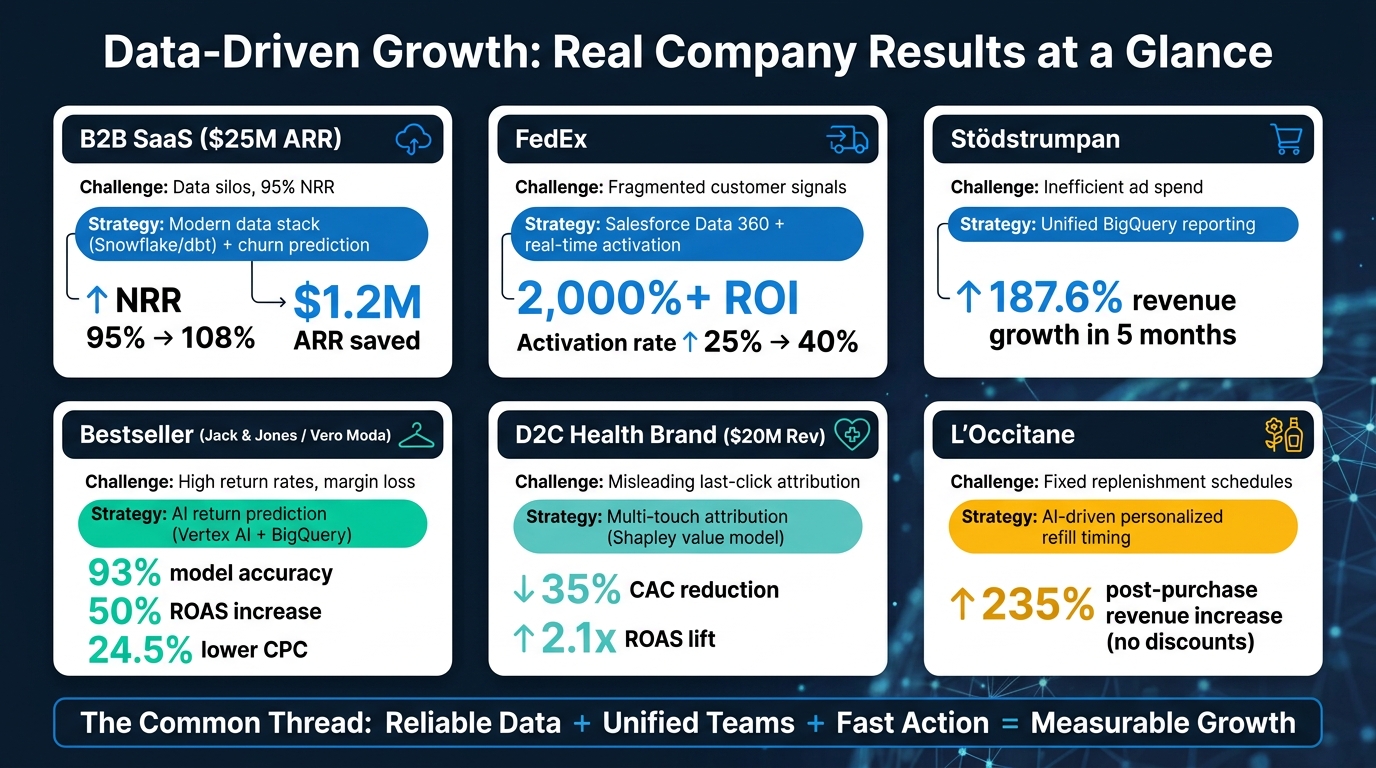
Data-Driven Growth: Real Company Results at a Glance
When companies take precise action based on strong data signals, the results can be transformative. These outcomes demonstrate how disciplined data strategies lead to measurable success, with examples showcasing impressive revenue growth and operational improvements.
Take the case of a $25M ARR B2B SaaS company. By implementing a modern data stack and churn prediction model, they increased their Net Revenue Retention (NRR) from 95% to 108% in just one quarter, saving $1.2M in ARR. Reflecting on this shift, their VP of Data remarked:
"We've said 'we're a data-driven company' for three years, but this is the first time it's actually true. The difference isn't the tools - it's that everyone now trusts the same numbers."
Other companies have seen equally impressive results. Stödstrumpan, for example, achieved 187.6% revenue growth in five months by adopting BigQuery-based reporting. They discovered that just 10% of their keywords drove 90% of non-brand revenue. This insight allowed them to scale their Meta Ads spend while improving profit margins. Meanwhile, a D2C health and wellness brand reduced their blended Customer Acquisition Cost (CAC) by 35% by transitioning from last-click attribution to a multi-touch Shapley value model. Surprisingly, this analysis revealed that their "best" channel was actually their least efficient.
Efficiency gains were also a standout theme. Bestseller, the Danish fashion company behind brands like Jack & Jones and Vero Moda, used Google Cloud's Vertex AI to build an AI-powered return-prediction model. This model achieved 93% accuracy, leading to a 24.5% drop in cost per click and a 50% increase in ROAS in the Netherlands. Jens Castenskjold Viborg, their Digital & Media Manager, summed it up:
"In an era of rising costs, the winner isn't the one who bids the most, but the one who knows exactly what a customer is worth before the bid is even placed."
These examples highlight how a strong data foundation and agile decision-making can deliver outstanding results across industries.
Case Study Comparison Table
| Company | Core Challenge | Data Strategy | Key Outcome |
|---|---|---|---|
| B2B SaaS ($25M ARR) | 95% NRR; data silos | Modern data stack (Snowflake/dbt); churn prediction | 108% NRR; $1.2M ARR saved |
| FedEx | Fragmented customer signals | Salesforce Data 360; real-time activation | 2,000%+ ROI; +13% activation rate |
| Stödstrumpan | Inefficient ad spend | Unified BigQuery reporting | 187.6% revenue growth in 5 months |
| Bestseller | High return rates; margin loss | AI return prediction (Vertex AI/BigQuery) | 93% accuracy; 50% ROAS increase |
| D2C Health Brand ($20M Rev) | Misleading last-click attribution | Multi-touch attribution (Shapley value) | 35% CAC reduction; 2.1x ROAS lift |
| Colossyan | SQL dependency; slow reporting | Self-serve product analytics (Mitzu) | 30% onboarding improvement; 3x faster decisions |
These results prove that success doesn't necessarily go to the companies with the largest budgets. Instead, it’s about building a reliable data foundation, eliminating internal barriers, and responding to insights faster than the competition.
Conclusion: What These Case Studies Tell Us About Data-Driven Growth
The case studies - from Bestseller's AI-powered return prediction to Georgia-Pacific's $25M spare parts optimization - highlight one key takeaway: success isn't just about gathering data; it's about creating systems that people trust and use effectively.
As Matt Robuck, VP of Data at Georgia-Pacific, explained:
"We manufacture products that are in 65% of US households, but we also manufacture decision-making systems."
This perspective emphasizes that data-driven growth demands more than just adopting new tools - it's about transforming the organization. It’s a shift in culture and processes, not just a technology upgrade. Tools like Snowflake, BigQuery, and dbt only deliver value when business logic is clear, shared, and consistent. Without this foundation, teams waste time reconciling discrepancies or performing manual data tasks instead of driving insights.
AI-driven platforms also play a critical role in this transformation. Reckitt's Barney Collins summed it up well:
"When technology solves exact challenges people face, adoption becomes natural."
For any data initiative to succeed, it must address real, everyday problems for its users.
The future of data-driven growth hinges on precision and clarity. It’s about focusing on the small percentage of efforts that yield the majority of results, transitioning from outdated last-click models to more comprehensive multi-touch attribution, and building predictive tools with transparent, easy-to-understand insights. The results speak for themselves: a $25M ARR SaaS company improved its NRR from 95% to 108%, while Reckitt's platform generated over $100 million in additional revenue. Companies with advanced digital capabilities are also 26% more profitable than their less mature counterparts.
The path to success often starts with a single, high-impact project - a churn model, a unified dashboard, or a self-serve reporting tool. These wins build trust and momentum, setting the stage for broader adoption and scaling. Ultimately, these examples show how digital-first organizations achieve sustainable growth by combining strong data practices with strategic action.
FAQs
What’s the first data project we should start with?
To set the stage for smarter decision-making, begin by creating a strong data infrastructure that brings all your key metrics together in one place. This could involve connecting various data sources - like e-commerce platforms, advertising tools, and email systems - into a unified system. Not only does this streamline your processes, but it also offers real-time insights that save time and effort.
Another approach is conducting a data audit. This helps you spot any gaps or inconsistencies in your current setup. Focus on your top three KPIs during this process to ensure you're prioritizing what matters most. Laying this groundwork ensures your data is accurate and ready to support advanced analytics and future growth strategies.
How do we standardize metrics across teams fast?
To get everyone on the same page with metrics, start by creating a shared metric dictionary. This should include agreed-upon definitions for terms like lead, MQL, CAC, and ROI. Use a primary system of record - such as a CRM - to centralize data, and make sure taxonomy and lifecycle stages are standardized across the board.
Governance is key here. A well-structured data model with version control can keep things aligned as definitions inevitably change. Also, don’t skip regular checks on data quality. Keeping metrics accurate builds trust and makes it easier for teams to collaborate quickly.
What data signals best predict churn and retention?
Understanding customer behavior is critical when it comes to predicting churn and improving retention. Some of the most telling signs include:
- Declines in login frequency: When users log in less often, it could indicate waning interest or satisfaction.
- Feature adoption: A lack of engagement with key features often signals that customers aren’t finding value in the product.
- Active days: Fewer active days can point to reduced reliance on the service.
- Stakeholder changes: Departures or shifts in key stakeholders within a company can be an early warning sign.
- Engagement metrics: Metrics like attendance at Quarterly Business Reviews (QBRs) can reveal whether customers are still invested.
Other signs to watch for include delays in renewal, higher volumes of support tickets, and shifts in customer sentiment. Interestingly, stakeholder departures or a noticeable drop in activity often occur 30–90 days before churn. By keeping a close eye on these patterns, businesses can act quickly to re-engage customers and boost retention.