Content dashboard analytics tools help you track and improve how your content performs, offering real-time insights and detailed metrics. These tools are essential for businesses looking to make data-driven decisions, especially in B2B marketing, where longer sales cycles and complex buyer journeys demand precise measurement. Here are the top six tools:
- Google Analytics 4 (GA4): Free, event-based tracking, seamless integration with Google tools, and machine learning insights.
- Databox: Centralizes data from 130+ tools, offers pre-built templates, and custom dashboards starting at $47/month.
- Looker Studio: Free, Google-friendly visualizations with 900+ connectors for data sources.
- Klipfolio: Connects to 400+ data sources, highly customizable dashboards with real-time updates.
- Domo: Enterprise-level tool with 1,000+ pre-built connectors, advanced real-time reporting, and high scalability.
- The B2B Ecosystem: Tailored for B2B needs, integrates CRM and marketing tools with AI-driven insights.
Quick Comparison
| Tool | Integration | Customization | Real-Time Reporting | Pricing |
|---|---|---|---|---|
| Google Analytics 4 | Strong with Google | Moderate | Excellent | Free |
| Databox | 130+ tools supported | High | Excellent | $47–$799/month |
| Looker Studio | Google-focused | Moderate | Good | Free (Pro available) |
| Klipfolio | 400+ sources | Extensive | Excellent | Custom pricing |
| Domo | 1,000+ connectors | High flexibility | Superior | Enterprise pricing |
| The B2B Ecosystem | B2B-focused tools | AI-driven options | Predictive insights | Service-based |
Each tool has unique strengths, so choose based on your business size, data needs, and budget. For small teams, free tools like GA4 and Looker Studio are great starting points. For larger enterprises, consider options like Domo or Klipfolio for advanced features. B2B companies may benefit from The B2B Ecosystem's tailored approach.
7 Best Dashboard Software Tools in 2024 [Full Software Demo]
1. Google Analytics 4
Google Analytics 4 (GA4) takes website tracking to a whole new level, shifting from traditional metrics to an event-based system that provides a detailed view of customer behavior. Unlike Universal Analytics, GA4 treats every interaction - whether it's a click, a scroll, or a purchase - as an event, giving teams a more complete picture of how users engage with their content.
What makes GA4 even more powerful is its ability to track users across both web and mobile platforms seamlessly. It also uses machine learning to automatically highlight key insights, helping teams pinpoint which content drives the most impactful user actions.
Data Integration
GA4 connects effortlessly with tools like Google Ads, Search Console, Display & Video 360, and popular CRMs like Salesforce and HubSpot. These integrations allow teams to measure how website content influences lead quality, conversion rates, and the overall sales pipeline.
| Software Category | Primary Integration | Alternative Options | Business Outcome |
|---|---|---|---|
| CRM | Salesforce | HubSpot, Zoho CRM | Combines website and customer data for a unified view |
| Email Marketing | Mailchimp | Mailerlite, Brevo | Tracks how visitors engage with email campaigns |
| SEO | Semrush | Ahrefs, Moz Pro | Links keyword rankings to user behavior insights |
| Call Tracking | Nimbata | CallRail, CallTrackingMetrics | Identifies channels driving valuable phone calls |
Take McDonald's Hong Kong, for example - they used GA4 to boost in-app orders by an impressive 550% by leveraging cross-platform tracking to refine the user experience across their website and app.
Customization
GA4 isn't just about data - it’s about tailoring that data to your needs. Teams can customize dashboards to focus on the metrics that matter most, such as engagement, scroll depth, or conversions. For organizations managing multiple properties, GA4 supports filtered report collections, ensuring each stakeholder gets data relevant to their specific goals.
For instance, one university created unique landing page reports for each school within its system. This way, every department could access insights tailored to its content priorities. Meanwhile, the Explorations tool in GA4 allows for advanced customization, enabling teams to build funnel reports, conduct cohort analyses, and compare user segments.
Real-Time Reporting
Real-time reporting is another standout feature of GA4. It provides up-to-the-minute insights on active users, traffic sources, and content performance, empowering teams to react quickly to trending topics or shifts in audience behavior.
Sara Swaney, Director of Advancement at 412 Food Rescue, shared how GA4 streamlined her team’s workflow:
"Google Analytics allows us to look at our data across platforms - web and app - to understand the full journey of our users. We've been able to cut our reporting time by 50%." - Sara Swaney, Director of Advancement, 412 Food Rescue
On top of that, GA4’s predictive metrics use machine learning to anticipate user behavior, helping teams identify which content is likely to drive future conversions. This forward-looking approach allows for smarter, more proactive content decisions.
Pricing
GA4 operates on a freemium model, offering a robust set of features at no cost. The standard version includes powerful analytics capabilities, custom reporting, and a wide range of integrations suitable for most content marketing needs. For businesses that require advanced tools - like unsampled reports, custom funnels, or extended data retention - GA4 360 provides an enterprise-level solution.
Lider is a great example of GA4's potential. By consolidating its website and app data into GA4, the company achieved an 18x increase in conversions while cutting its cost per action by 85%.
2. Databox
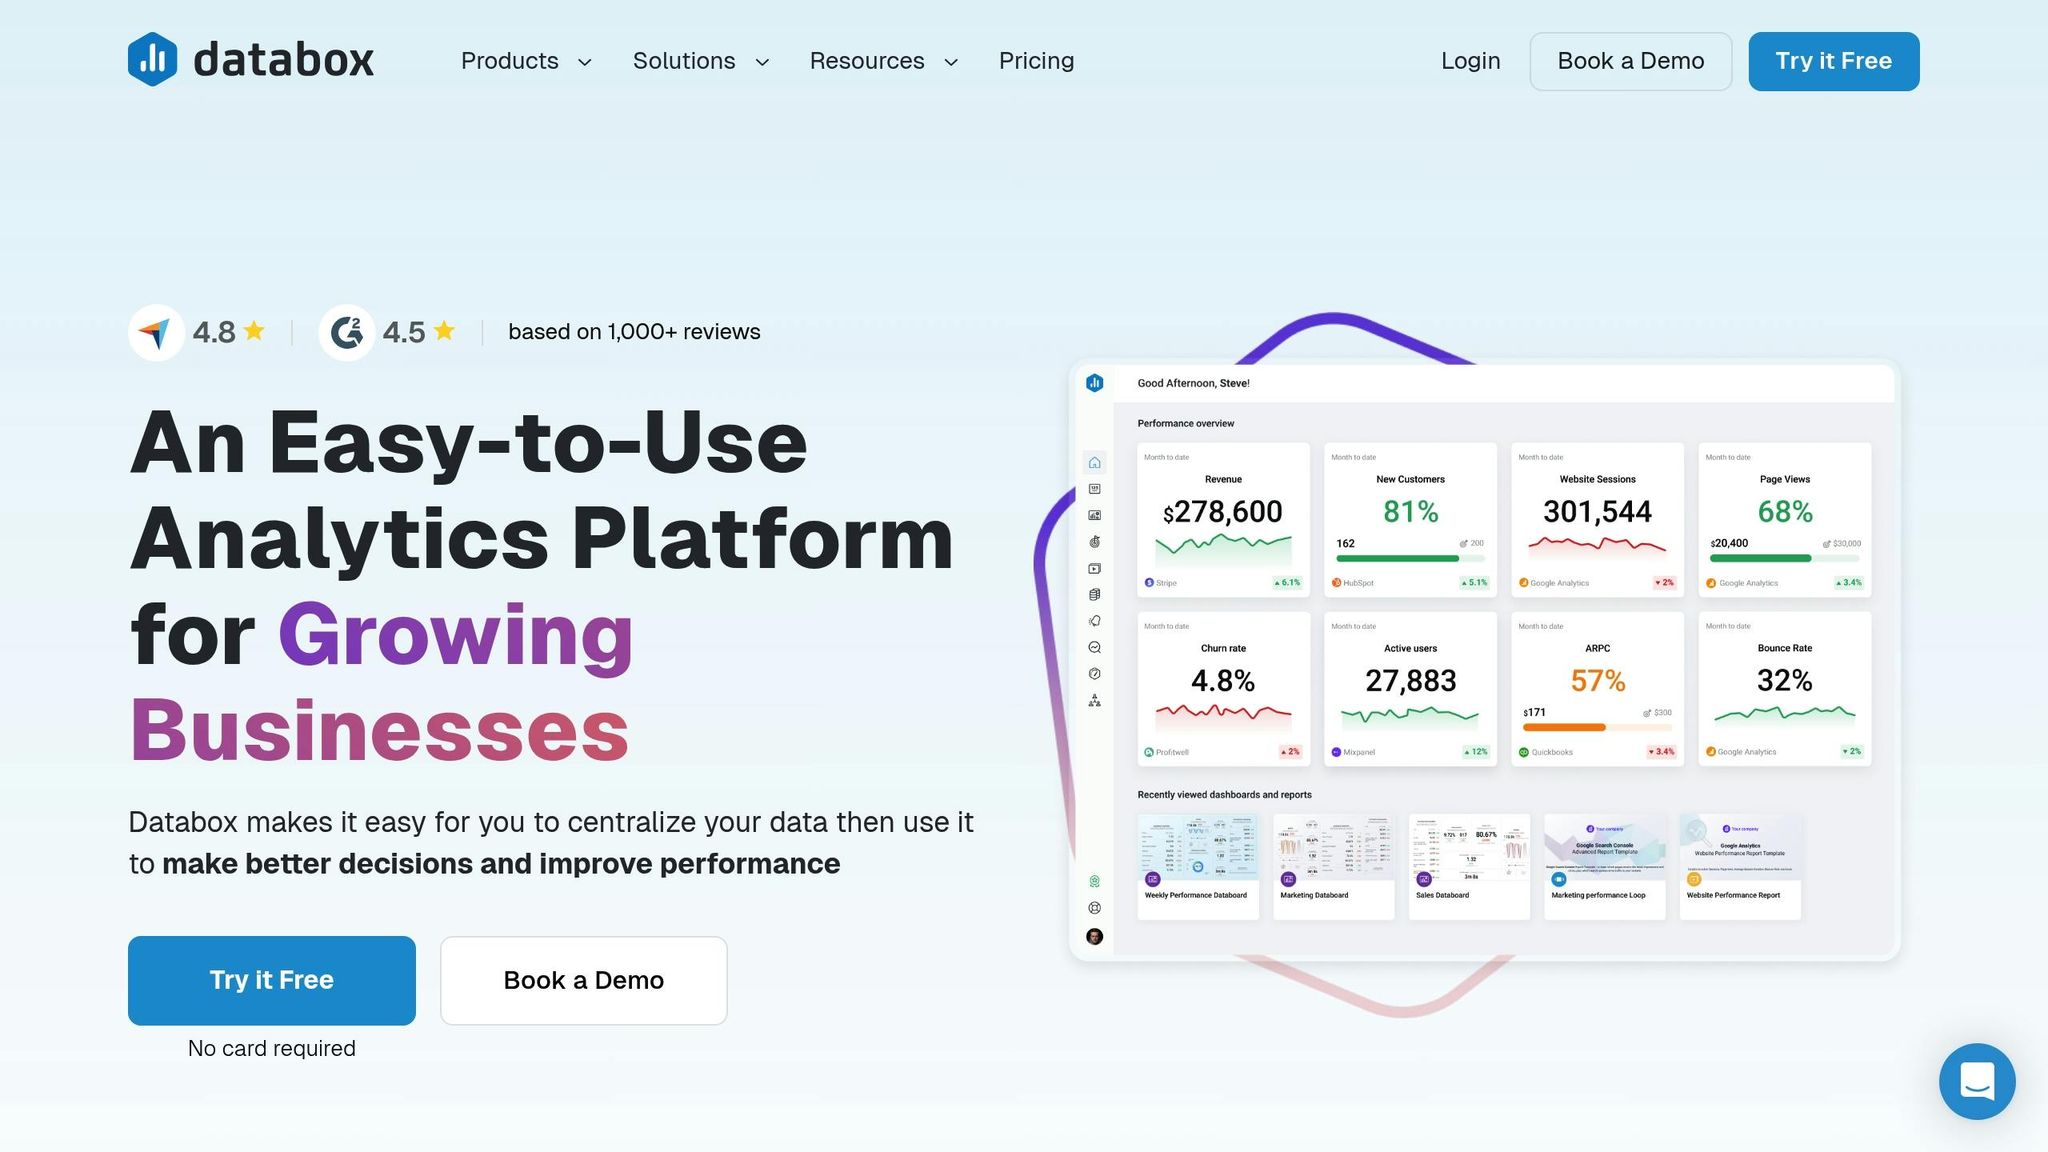
While GA4 provides real-time analytics, Databox stands out by bringing data from multiple sources into one cohesive platform. It consolidates information from 130+ software tools, databases, APIs, and spreadsheets into unified reports, making it easier for teams to monitor website traffic, social media engagement, and more - all in a single dashboard.
Databox simplifies the process of tracking how blog content generates leads in HubSpot, analyzing SEO performance with Semrush, and measuring social media metrics from platforms like Facebook. Everything is centrally accessible, eliminating the need to jump between tools.
Data Integration
Databox offers seamless integrations with essential tools like Google Analytics 4, HubSpot Marketing, Salesforce, and Semrush. Whether it’s analytics, CRM, email marketing, social media, SEO, or project management, Databox connects with the tools you already use. For more specialized needs, it supports SQL database connections, API integrations, Google Sheets imports, and even works with Zapier to integrate virtually any software in your content marketing stack.
Here’s a quick look at some key integrations:
| Integration Category | Popular Tools | Content Use Case |
|---|---|---|
| Analytics | Google Analytics 4 | Monitor website and content performance |
| CRM | HubSpot Marketing, Salesforce | Track leads and marketing campaigns |
| SEO | Semrush | Analyze keyword rankings and organic traffic |
| Social Media | Evaluate social media engagement |
A great example of Databox’s integration capabilities comes from Nectafy, a growth-focused content marketing agency. They use Databox to connect HubSpot Marketing and track metrics like website traffic, organic sessions, lead sources, and average session durations for their clients. By creating separate dashboards for website and blog performance and sharing results via links during monthly client meetings, they’ve built a system that delivers clarity and insight effortlessly.
Customization
Databox provides over 200 customizable dashboard templates to help users get started quickly. With the Dashboard Designer, teams can build dashboards from scratch or use a setup wizard. Its drag-and-drop interface makes it simple to add, resize, or remove metrics and switch between visualization types. Plus, dashboards can be branded with custom colors and logos to create a polished, professional appearance.
Steve James, a Partner at Stream Creative, highlights the benefits:
"The Dashboard Designer has provided our team and clients the flexibility and efficiency to build custom dashboards whenever necessary. It's amazing how easy it is to pull data and top KPIs from multiple data sources into one screen. It's hard to imagine our team ever going back to building reports manually."
Beyond standard metrics, Databox’s Metric Builder allows users to create custom calculations tailored to their needs. Whether it’s tracking content engagement scores or evaluating lead quality, teams can design metrics that align perfectly with their business goals.
Real-Time Reporting
Databox ensures teams have access to the most current insights, enabling them to react quickly to changes in performance. For example, managers can simultaneously monitor how a blog post is performing across organic search, social media shares, and email click-throughs. This real-time data provides a complete view of content impact as it unfolds.
Pricing
With a 4.8-star rating on Capterra and trusted by over 20,000 businesses, Databox has become a go-to solution for content teams looking to simplify their analytics workflow. It’s a tool designed to save time and deliver actionable insights, helping teams focus on what matters most.
3. Looker Studio
Looker Studio, previously known as Google Data Studio, offers robust content dashboard analytics completely free of charge. As of July 2025, it boasts over 900 native and partner connectors, giving content teams a wide range of options to visualize their performance data effectively.
What makes Looker Studio stand out is its ability to transform complex data into easy-to-read visuals. Whether you're analyzing blog metrics, social media engagement, or email campaign results, it turns raw numbers into actionable insights.
Data Integration
One of Looker Studio's strengths is its seamless integration with key content marketing tools. It connects effortlessly to platforms like Google Analytics 4, Google Ads, YouTube Analytics, and Google Search Console, providing a complete view of your content's performance across Google's ecosystem.
It doesn't stop there - Looker Studio also links with popular platforms such as Facebook Ads, Instagram, Twitter, LinkedIn, and a variety of email marketing services. For teams relying on CRM systems or project management tools, the platform supports database connections and API integrations, consolidating all content-related data into one place.
This streamlined process eliminates the need for manual data exports. By unifying data sources, Looker Studio allows teams to create customized visuals that align with their specific needs.
Customization
Looker Studio offers a wide range of customization options, enabling teams to design dashboards that reflect their unique goals and brand identity. You can tweak almost every visual element, from colors and fonts to chart types and data ranges.
The platform includes practical features for building content dashboards. Teams can design custom banners, add scorecards to highlight key metrics, create interactive buttons for navigation, and use filter controls to focus on specific performance data. It even extracts color themes from uploaded images to ensure brand consistency.
For added flexibility, Looker Studio supports custom fonts through community visualizations, though it maintains a focus on readability by limiting font choices. By using different fonts for titles, values, and descriptions, teams can establish clear visual hierarchies.
In addition to visual customization, Looker Studio provides immediate data tracking, helping teams make informed decisions without delay.
Real-Time Reporting
Looker Studio's real-time reporting capabilities are a game-changer for content teams. With instant access to live data, teams can monitor performance as it happens and make timely adjustments. This feature is particularly helpful for spotting trends, addressing issues, and making smarter decisions that enhance content outcomes.
During active campaigns, real-time reporting becomes even more valuable. Teams can track blog performance across channels, watch social media engagement unfold, and monitor email metrics as they come in. This immediate feedback allows for quick adjustments, whether it's refining social media strategies, tweaking email subject lines, or updating content based on early indicators.
Interactive dashboards further enhance this functionality, giving teams the tools to respond to insights as they emerge rather than waiting for periodic reports.
Pricing
One of Looker Studio's biggest advantages is its price - it's completely free. There are no subscription fees, user caps, or hidden costs. Teams can create unlimited dashboards and reports without worrying about budget constraints.
This makes Looker Studio an appealing choice for small teams, startups, or organizations aiming to maximize their analytics capabilities without incurring extra software expenses. Its combination of powerful features and zero cost makes it an excellent option for data-driven content strategies.
4. Klipfolio
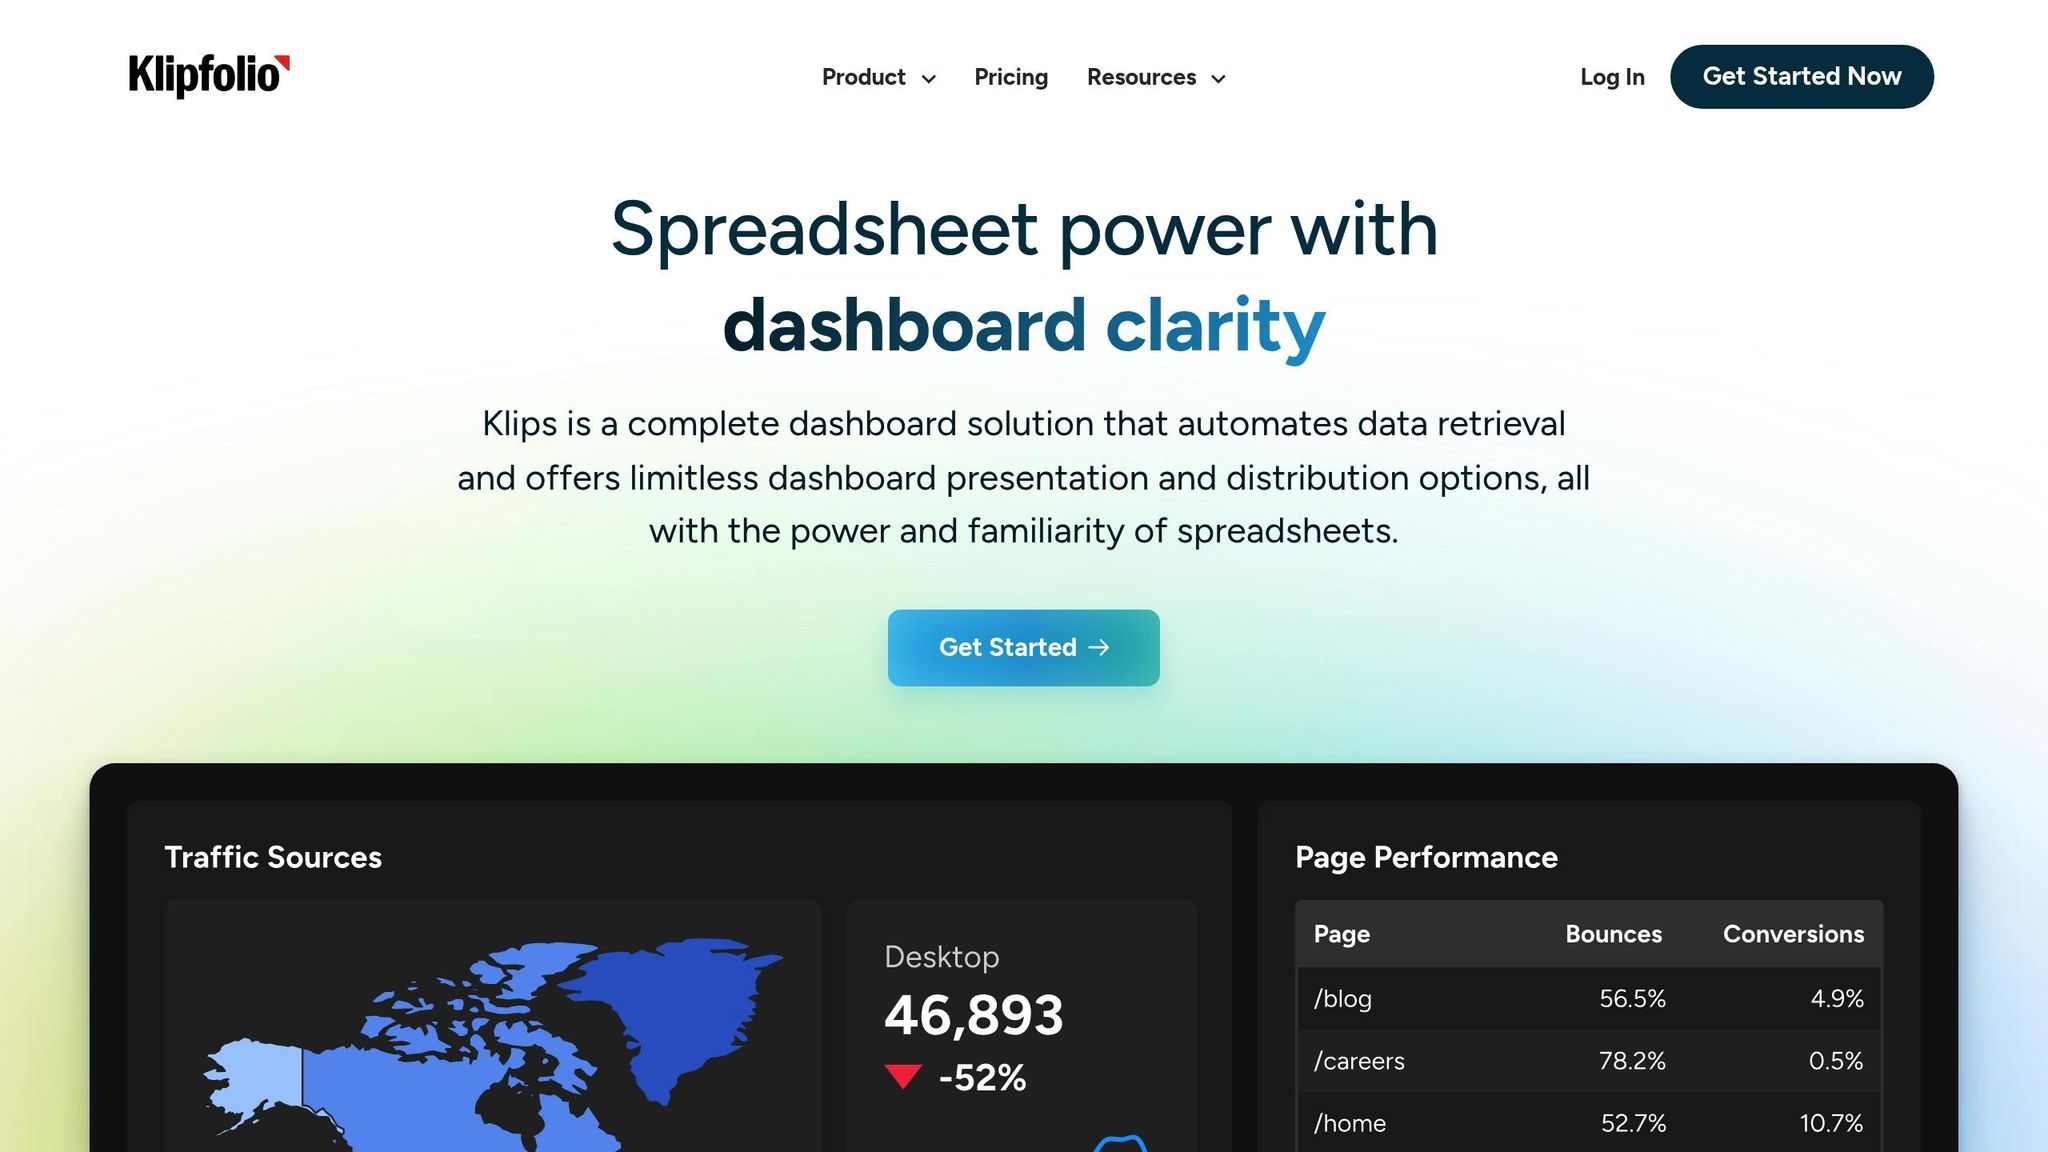
Klipfolio is a cloud-based dashboard platform that connects with over 400 data sources. It consolidates content marketing metrics - ranging from blog performance to SEO data - into a single, real-time view.
Data Integration
Klipfolio shines when it comes to integrating data. It offers dedicated connectors and REST/URL integration with multiple authentication options. For content analytics, it connects seamlessly with major platforms like Google Analytics 4, Google Search Console, social media and ad platforms, email and CRM tools, SEO software, and even data warehouses like Amazon Redshift, Google BigQuery, and Snowflake. It also integrates with project management tools such as Asana, Trello, Basecamp, and Jira.
Thanks to its Zapier integration, Klipfolio can tap into thousands of additional apps. Teams can even link SQL databases that are accessible online, making it a highly versatile tool for data-driven decision-making.
Customization
Customization is one of Klipfolio's standout features. Users can tweak nearly every aspect of their dashboards, from applying custom themes and white-labeling options to choosing infinite layouts and enabling dark mode. There’s pixel-level control for those who need precision.
The platform allows users to upload logos, define custom colors, and create unique themes using CSS and JavaScript uploads. Individual widgets and charts can also be tailored using the Klip Editor or by building visualizations with HTML, JavaScript, and inline CSS. For teams, Klipfolio supports sharing dashboard styles to ensure consistency while still meeting specific departmental needs.
"I like how much you can customize the look and feel of your dashboard." - Carolyn S., People Insights Manager at formstack.com
These robust customization options pair perfectly with Klipfolio's reporting capabilities.
Real-Time Reporting
Klipfolio takes full advantage of its integration and customization features to deliver real-time reporting. Its live data streams ensure teams stay informed as events unfold. Whether you’re tracking social media engagement during a campaign, monitoring website traffic during a content push, or analyzing email open rates, Klipfolio updates dashboards in real time.
This feature is a game-changer for fast-paced environments like social media, where quick responses to trends or emerging issues can make all the difference. To add another layer of functionality, teams can set alerts for key metrics, ensuring nothing important slips through the cracks.
sbb-itb-01010c0
5. Domo
As businesses expand and their data needs grow, Domo steps in as a powerful solution for large-scale data management. Trusted by 32% of Fortune 40 companies, Domo handles massive volumes of data - processing over 100 trillion rows daily with lightning-fast query speeds.
Data Integration
Domo simplifies data integration with more than 1,000 pre-built connectors that link to virtually any data source, whether it's cloud-based, on-premises, or flat files. Its bi-directional connections allow teams to pull data and push actionable insights seamlessly. For companies with secure databases, Domo Workbench ensures safe connections to on-premises systems, while federated connectors enable direct querying of data from existing warehouses and lakes without the need to move it. Additionally, teams can create custom integrations using Domo's SDKs, offering flexibility for unique business requirements.
Customization
Domo provides extensive customization options through its Domo Stories feature, which includes hundreds of layout templates tailored to various business needs. Using a drag-and-drop interface, teams can design branded dashboards, choosing from over 150 chart types and 7,000 custom maps. Users can tweak everything from background colors to card titles and summary numbers, even setting up interactions like opening detailed views or triggering specific actions.
"Instead of just consuming data in a table format like before, people can now visualize it in charts and graphs. One of my favorites is visualizing data on a US map, which can show very quickly where we are leading, where we are lagging, and how it's impacting our KPIs."
- Madison Smith, Senior Manager of Finance, Life Time
Domo Stories ensures dashboards look consistent across devices, keeping card orientation and sizing uniform whether viewed on a desktop or mobile device. The auto width feature further enhances the experience by dynamically adjusting content to fit the screen, making it easy to view data on any platform.
Real-Time Reporting
Domo revolutionizes performance monitoring with real-time reporting, replacing outdated static spreadsheets. It's no surprise that 90% of the largest global companies now use data streaming to improve customer experiences. With live KPI dashboards, teams can track performance in real time, identify trending topics, monitor campaign success, and respond quickly to audience engagement. The platform also automates data cleaning, structuring, and analysis, delivering actionable insights without requiring manual effort.
"We make real-time decisions based on the power of the data that we are able to see in Domo."
- Allison Vance, Chief of Staff
Domo’s alert system ensures teams stay on top of critical metrics by flagging performance exceptions like traffic surges, engagement declines, or conversion rate changes. Automated notifications keep everyone informed, enabling faster, more agile decision-making.
"Alerts and scheduled reports are probably the features that have the highest usage in all our organization."
- Linda Fligg, Senior Business Operations Analyst
With its advanced capabilities, Domo stands out as a robust tool for businesses looking to optimize their data-driven strategies.
6. The B2B Ecosystem
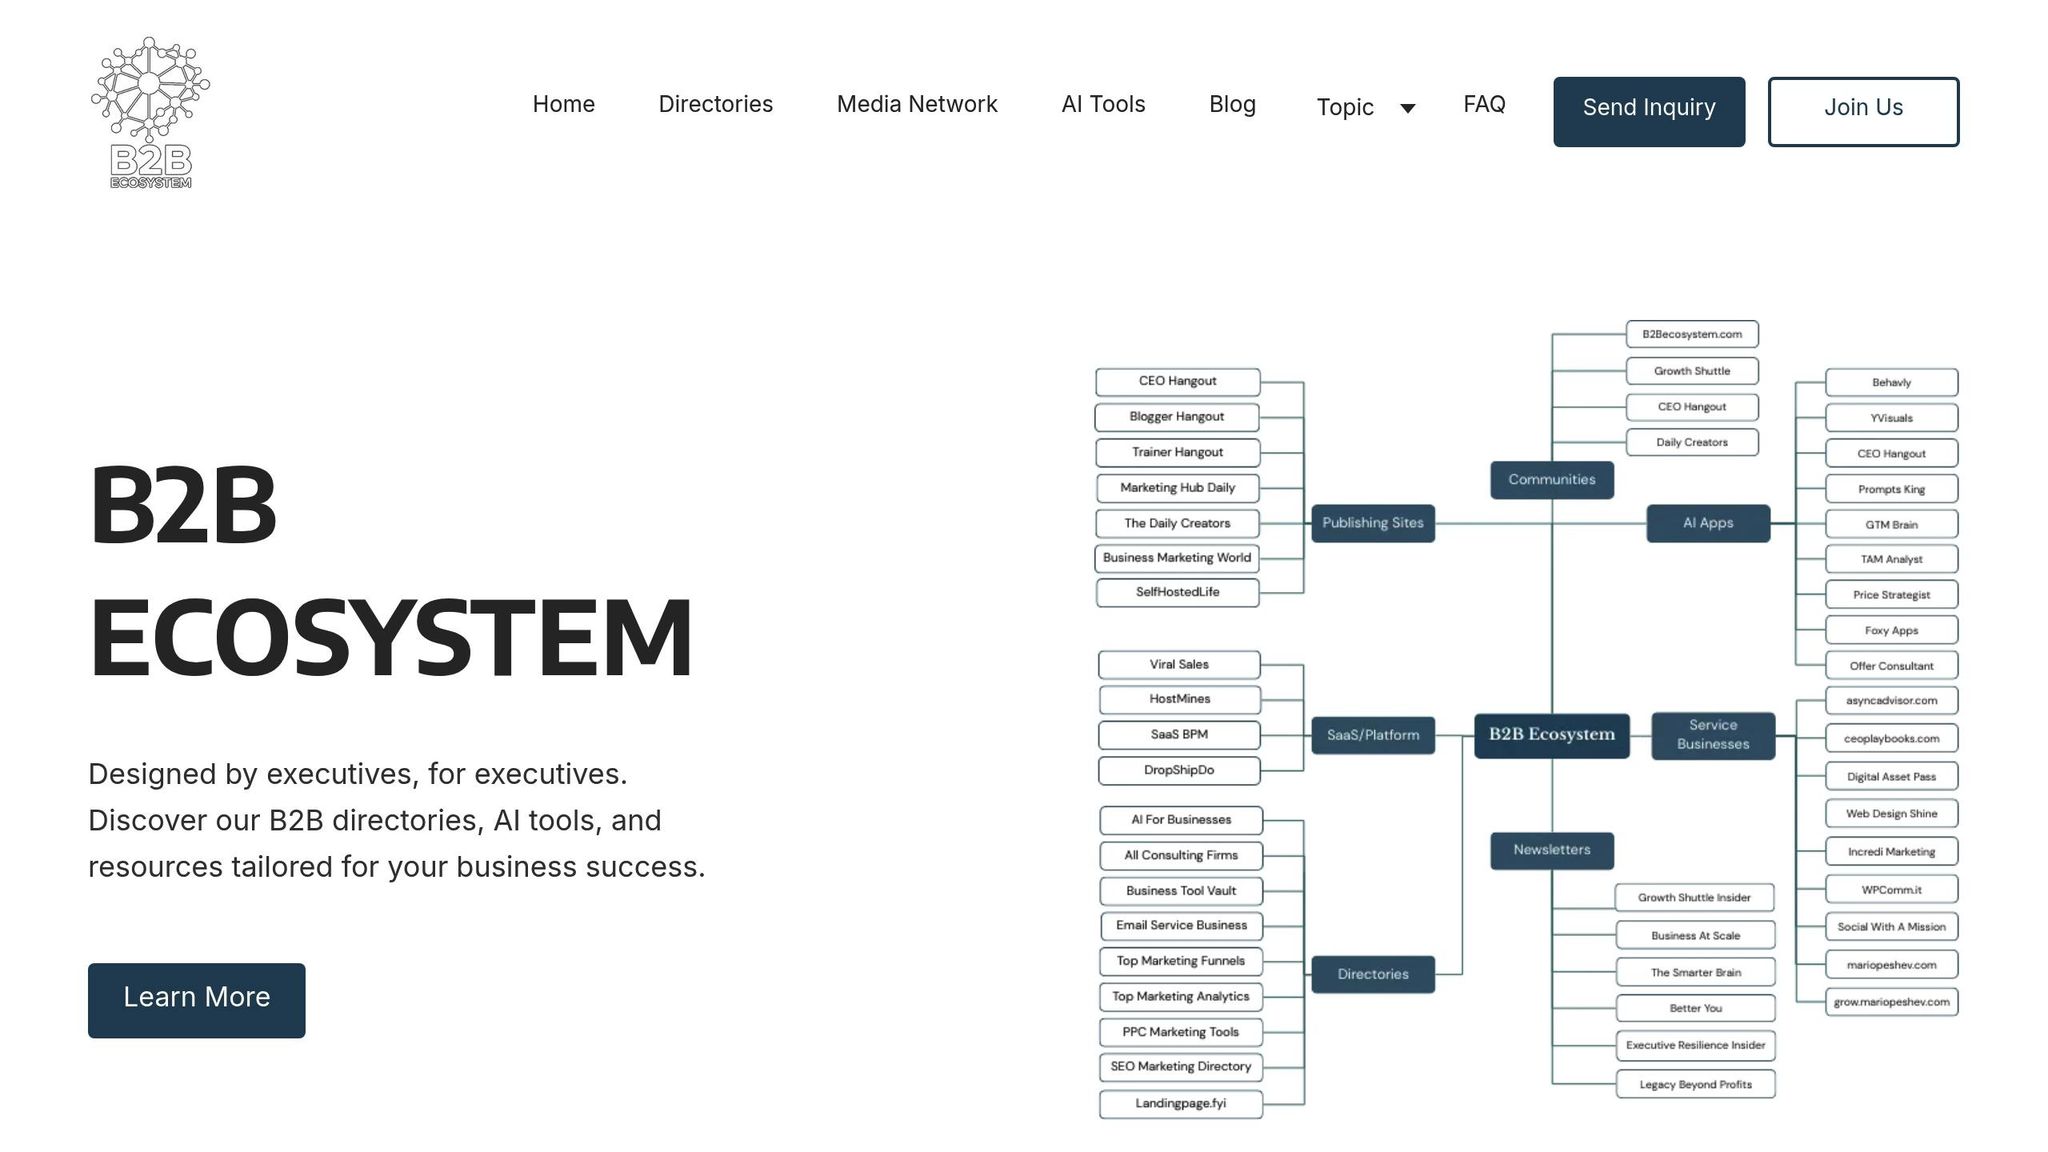
The B2B Ecosystem brings together seamless data integration and AI-driven insights to fine-tune the performance of B2B content. As a digital media network and holding company, it offers specialized tools crafted specifically for B2B organizations aiming to improve their content strategies and decision-making processes. While it shares some similarities with other platforms, its features are tailored to meet the unique demands of B2B operations.
Data Integration
This platform simplifies the flow of information between content management systems, CRM platforms, and marketing automation tools by using standardized formats. Considering the B2B integration market is projected to reach $11.6 billion by 2030, with a growth rate of 7.2% annually, businesses can leverage this tool to create personalized content experiences using comprehensive customer data.
"By 2023, over 50% of B2B transactions will be performed through real-time APIs versus traditional approaches." – Gartner
The system ensures consistent data exchange through uniform formats and supports multiple communication protocols. With built-in analytics and reporting tools, teams can monitor integration processes in real time, identifying bottlenecks and opportunities for improvement.
Customization
What sets The B2B Ecosystem apart is its ability to address specific B2B challenges through targeted integrations and customizable features. With 42% of companies now utilizing advanced dashboard technologies, the platform offers flexible drill-down tools that allow users to filter by content type, topic clusters, customer segments, and time periods.
Dashboards can be tailored to meet the needs of different team members. For example, executives can focus on high-level KPIs, while content creators can dive into detailed performance metrics. The system’s adaptive design learns from user interactions, recommending relevant visualizations over time. By implementing these tools, companies can reduce operational inefficiencies by as much as 35%.
Users are encouraged to align their objectives with specific content goals, ensuring dashboards provide actionable insights. Regular evaluations help teams focus on meaningful metrics while eliminating those that no longer serve a purpose.
Real-Time Reporting
The platform’s real-time analytics provide predictive insights, enabling businesses to track content performance across multiple channels and make immediate, data-driven decisions. These capabilities are essential in today’s market, where B2B buyers often engage with more than ten channels during their purchasing journey.
Real-time reporting is particularly valuable given that 71% of buyers are willing to spend over $50,000 in a single transaction through remote or self-service models. This shift highlights the need for instant visibility into content performance and customer engagement patterns, allowing businesses to optimize their digital experiences effectively. These features align seamlessly with the platform’s flexible, service-based pricing model.
Pricing
The B2B Ecosystem includes a suite of AI-powered tools under the QuantAIfy brand, each designed to address specific business optimization challenges. Key tools include:
- GTM Brain: Assists with go-to-market strategy evaluations.
- Price Strategist: Tests pricing plans and analyzes competitors.
- TAM Analyst: Delivers detailed market breakdowns.
Other tools, such as the AI Process Optimizer, help modernize outdated workflows, while the Leadership Roadmap provides a personalized 12-month strategic plan. The Market Entry Navigator offers tailored strategies for entering new markets, and the Risk Analyzer automates risk scoring based on financial and market data.
The platform’s pricing is service-based, offering options like premium directory listings, sponsorship packages, and custom tool development to meet diverse business needs.
Advantages and Disadvantages
Here's a breakdown of the key strengths and weaknesses of each tool, focusing on integration, customization, real-time reporting, and pricing. Recognizing these trade-offs can help you make informed decisions to enhance your content dashboard's performance.
Google Analytics 4 is a powerful, free analytics platform that integrates seamlessly with Google's ecosystem. It excels in tracking capabilities but comes with a steep learning curve and offers limited options for advanced customization.
Databox stands out for its user-friendly interface and affordable pricing, with plans ranging from $47 to $799 per month. Even at lower tiers, it provides unlimited dashboards and excellent pre-built integrations. However, it may not meet the needs of larger enterprises requiring more complex analytics and data modeling.
Looker Studio offers great value with its free tier and an extensive library of templates, making it ideal for small businesses and startups. While it integrates well with Google services, scaling to Pro versions can become costly, and its visualization features are less advanced than those of specialized business intelligence (BI) tools.
Klipfolio delivers robust dashboard customization and real-time reporting capabilities. However, it demands significant technical expertise to unlock its full potential, which can be a challenge for teams without dedicated data analysts.
Domo excels in real-time collaboration and mobile accessibility, making it perfect for distributed teams. On the flip side, its high cost and complexity might not be suitable for smaller organizations with limited budgets or simpler analytics requirements.
"The best BI tools aren't necessarily the most expensive but the ones that align with your specific business needs." – Lillian Pierson, Data Strategist
The B2B Ecosystem focuses on B2B analytics through its QuantAIfy suite. Its service-based pricing model offers flexibility, but businesses accustomed to traditional subscription models might find this approach less predictable.
Here's a quick comparison to summarize the tools:
| Tool | Data Integration | Customization | Real-Time Reporting | Pricing |
|---|---|---|---|---|
| Google Analytics 4 | Excellent Google ecosystem integration, limited third-party connections | Moderate customization, restricted advanced features | Strong capabilities | Free |
| Databox | Good integration with 100+ tools | High dashboard customization | Excellent updates | $47–$799/month |
| Looker Studio | Strong Google services integration | Moderate template-based customization | Good reporting | Free to paid Pro |
| Klipfolio | Wide range of data source connections | Extensive customization options | Excellent dashboards | Custom pricing |
| Domo | Robust enterprise integrations | High customization flexibility | Superior collaboration | Enterprise pricing |
| The B2B Ecosystem | Seamless B2B tool integration | AI-driven adaptive customization | Predictive insights | Service-based pricing |
Selecting the right tool is more than just picking software - it’s a strategic investment. According to McKinsey, data-driven organizations are 23 times more likely to acquire customers and 19 times more likely to be profitable. Matching a tool’s capabilities to your specific needs can help ensure long-term success as your analytics requirements evolve.
Final Thoughts
Finding the right content analytics tool is all about matching it to your business's specific needs. The numbers speak for themselves - data-driven businesses are 23 times more likely to acquire customers and 19 times more likely to be profitable. Yet, surprisingly, only 24% of small businesses consider themselves "data-driven".
If you're a small or medium-sized business working with limited resources, Google Analytics 4 and Looker Studio are excellent starting points. These free tools integrate seamlessly within Google's ecosystem. Looker Studio, for instance, boasts an impressive G2 rating of 4.4/5, delivering great functionality without added costs. For businesses that need a step up in features, Databox offers an affordable alternative with more advanced capabilities.
For enterprise organizations dealing with complex data and requiring robust solutions, platforms like Domo or Klipfolio are worth exploring. These tools excel in customization and real-time collaboration, making them ideal for handling large datasets and scaling with growth. However, keep in mind that they may demand a higher level of technical expertise.
Before committing to any tool, take the time to evaluate your current needs and anticipate how they might change as your business grows. Start by identifying the key metrics you want to track and take advantage of free trials to test integrations and features.
For businesses operating in the B2B space, the QuantAIfy suite from the B2B Ecosystem is a standout option. This platform offers AI-powered insights and predictive analytics, delivered through a flexible, service-based pricing model. It's particularly well-suited for companies needing tailored B2B metrics and custom dashboards, aligning with the demand for seamless integration and adaptability.
The importance of analytics is only increasing - 77% of marketers expect measurement tools to play a bigger role going forward. And businesses using advanced analytics solutions see their revenue grow by 2.4 times. The evidence is clear: the right analytics platform can have a direct, measurable impact on your bottom line.
Ultimately, focus on tools that match your current technical abilities but also provide room to grow. The best choice isn't necessarily the most expensive - it’s the one that helps you make smarter, data-driven decisions.
FAQs
What should I consider when choosing the right content dashboard analytics tool for my business?
When choosing a content dashboard analytics tool, it’s important to align your choice with your business goals and daily operations. Start by clarifying what you need - whether it’s tracking user behavior, evaluating how your content performs, or keeping an eye on marketing metrics. Look for tools that provide real-time updates, customizable dashboards, and seamless integration with your existing systems.
Think about the features that matter most to your team. Do you need advanced data segmentation, predictive analytics, or straightforward visualizations? Also, make sure the tool matches your team’s technical skills and can handle the scale of your operations. Selecting a platform that’s easy to use, adaptable, and designed to meet your specific needs will help you make smarter decisions and get the most out of your content strategies.
What’s the difference between free tools like Google Analytics 4 and paid platforms such as Domo or Klipfolio?
The Main Differences Between Free Tools and Paid Platforms
When comparing free tools like Google Analytics 4 to paid platforms such as Domo or Klipfolio, the key distinctions come down to features, scalability, and the type of users they serve.
Google Analytics 4 is a no-cost solution tailored for small to medium-sized businesses. It provides essential insights into website and app performance, user behavior, and traffic sources. For businesses with straightforward analytics needs, it’s a solid starting point.
In contrast, paid platforms like Domo and Klipfolio cater to larger organizations with more complex data demands. These tools offer advanced capabilities, including real-time dashboards, extensive data integration, and customizable visualizations. Domo is particularly noted for its cloud-based collaboration features, while Klipfolio shines with its flexibility and support for a wide range of third-party integrations.
For companies seeking more in-depth insights, stronger data management, and enhanced collaboration options, investing in a paid platform can be a smart move.
How do real-time reporting features in analytics tools improve content marketing strategies?
Real-time reporting gives marketers the ability to act swiftly based on audience behavior and campaign performance. With up-to-the-minute insights, you can quickly spot what’s hitting the mark and what might need tweaking, allowing you to make adjustments in real time.
This flexibility often translates to higher engagement, better campaign results, and smarter use of resources. In essence, real-time data equips you to fine-tune your content marketing strategies for the best possible ROI while staying in sync with what your audience wants.